Sampling and Bootstrapping
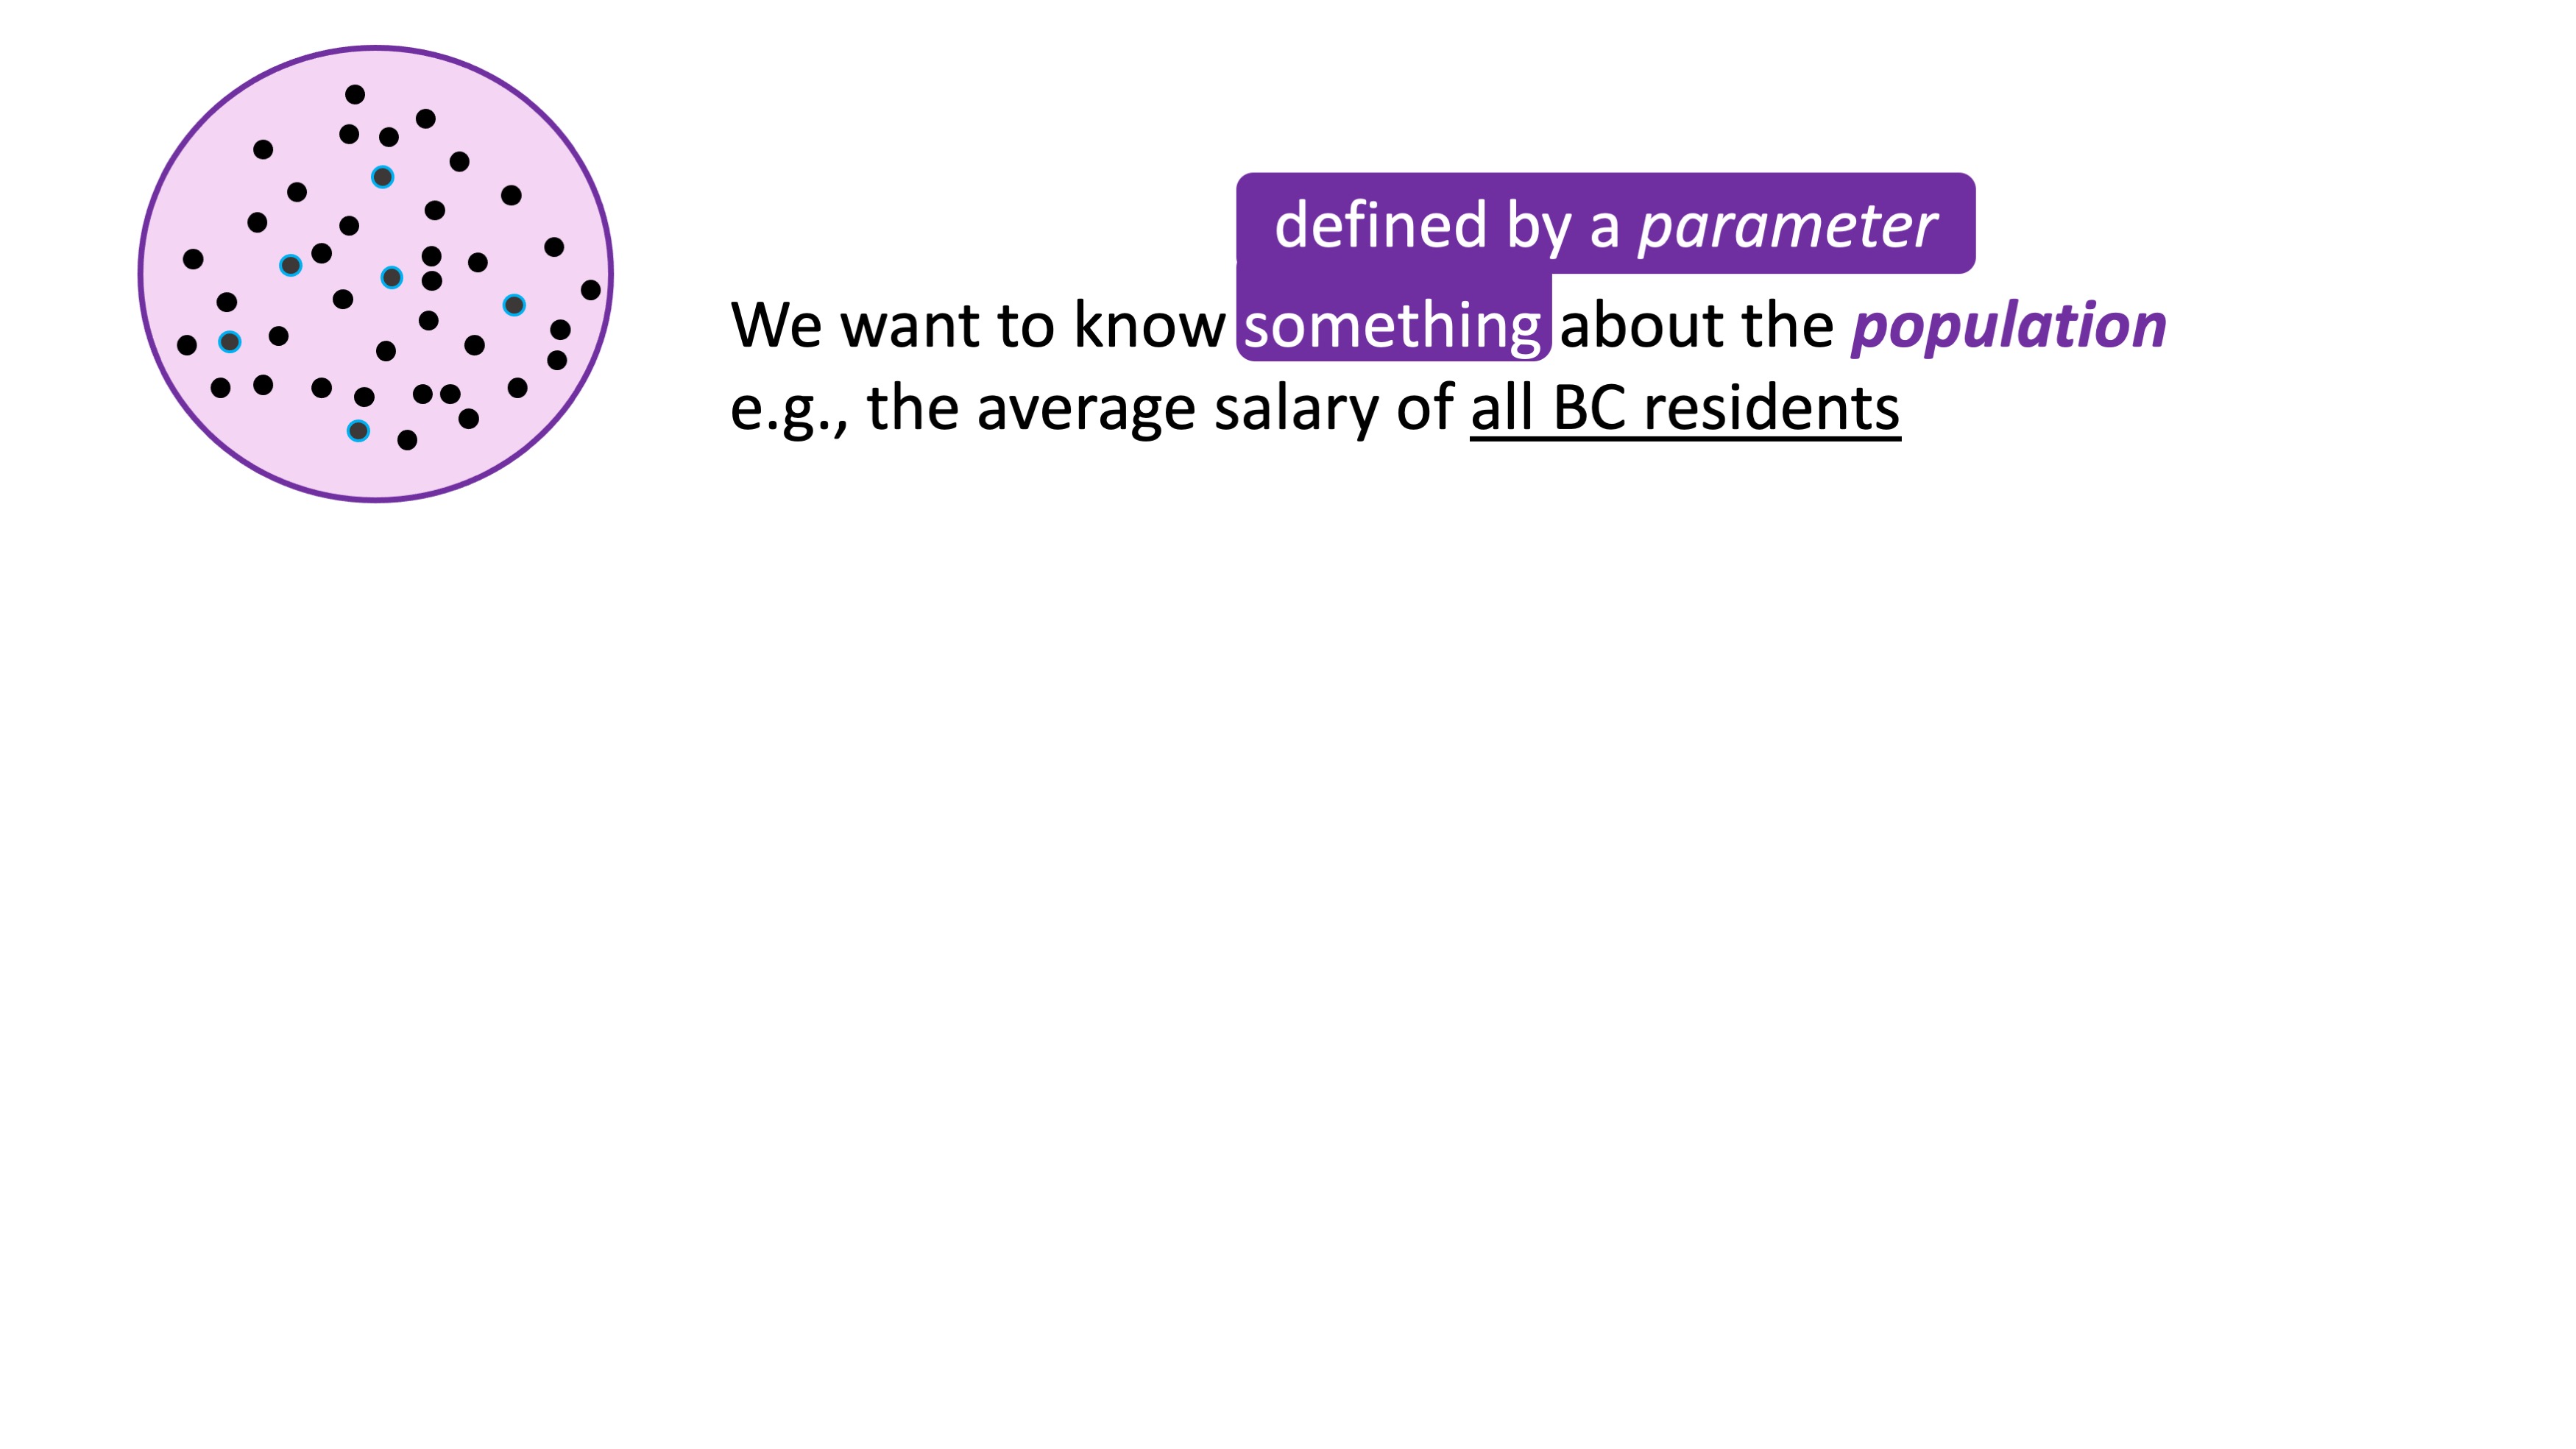
Populational Concepts













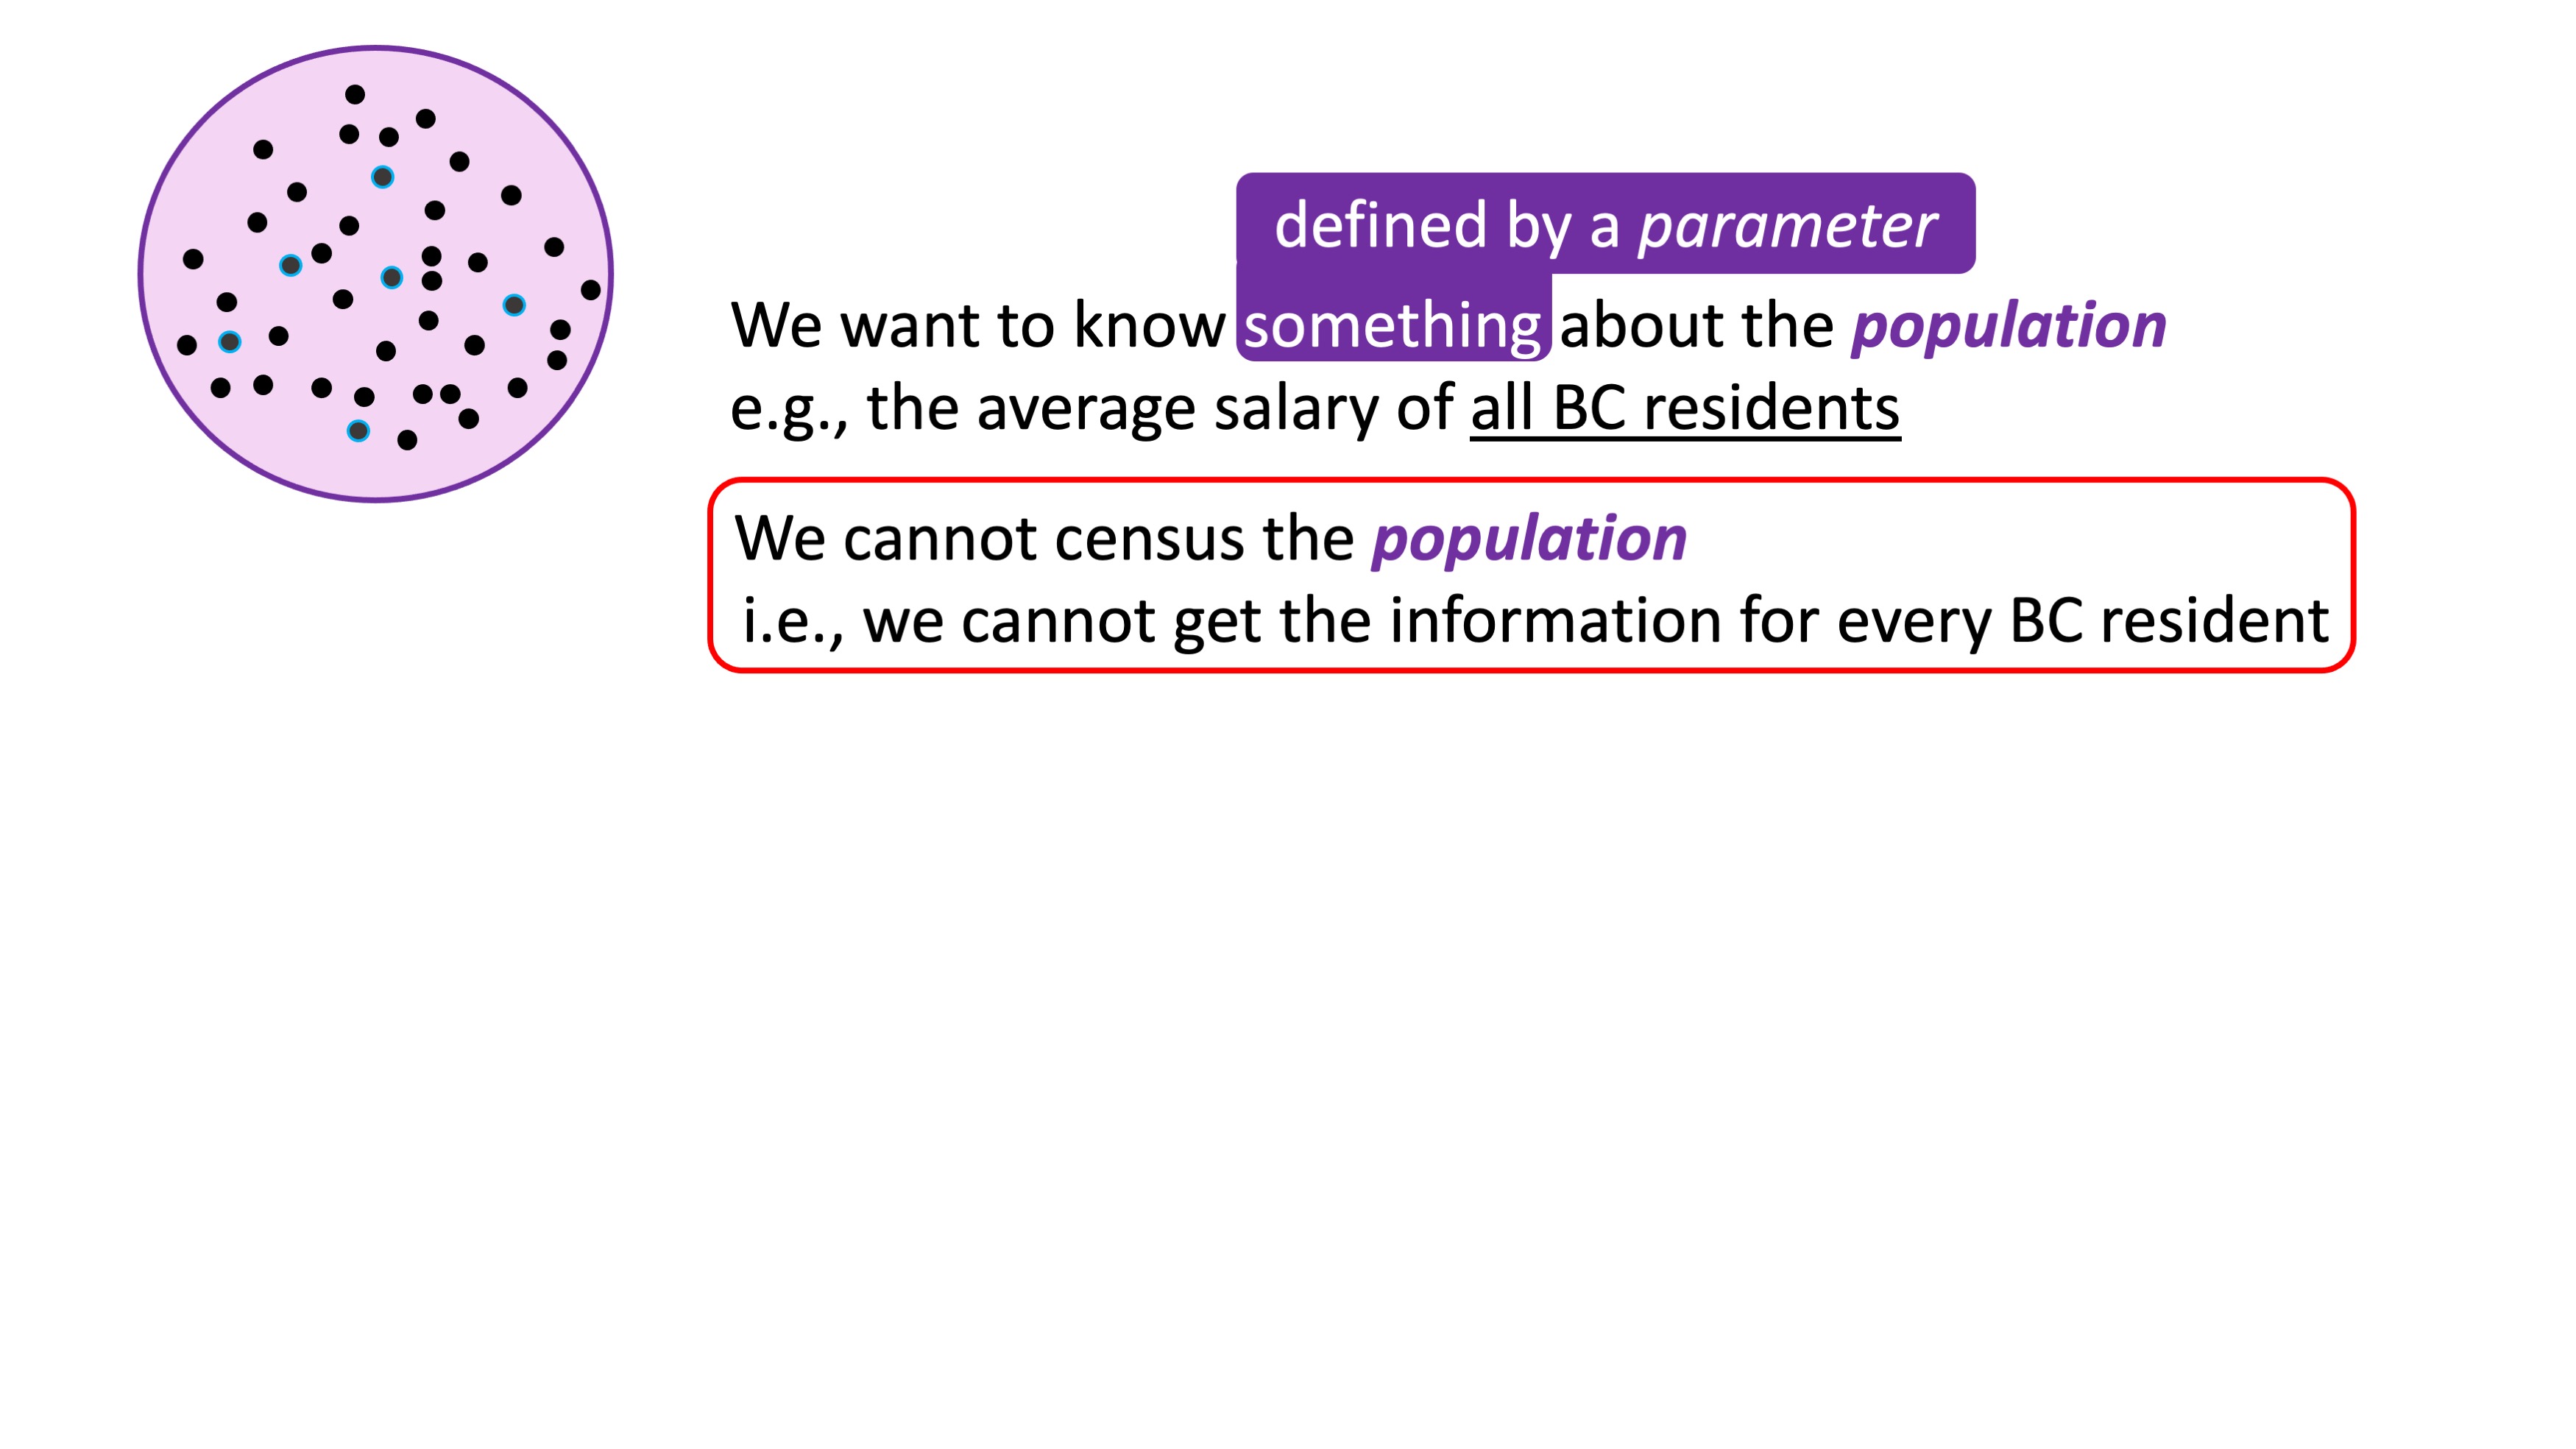
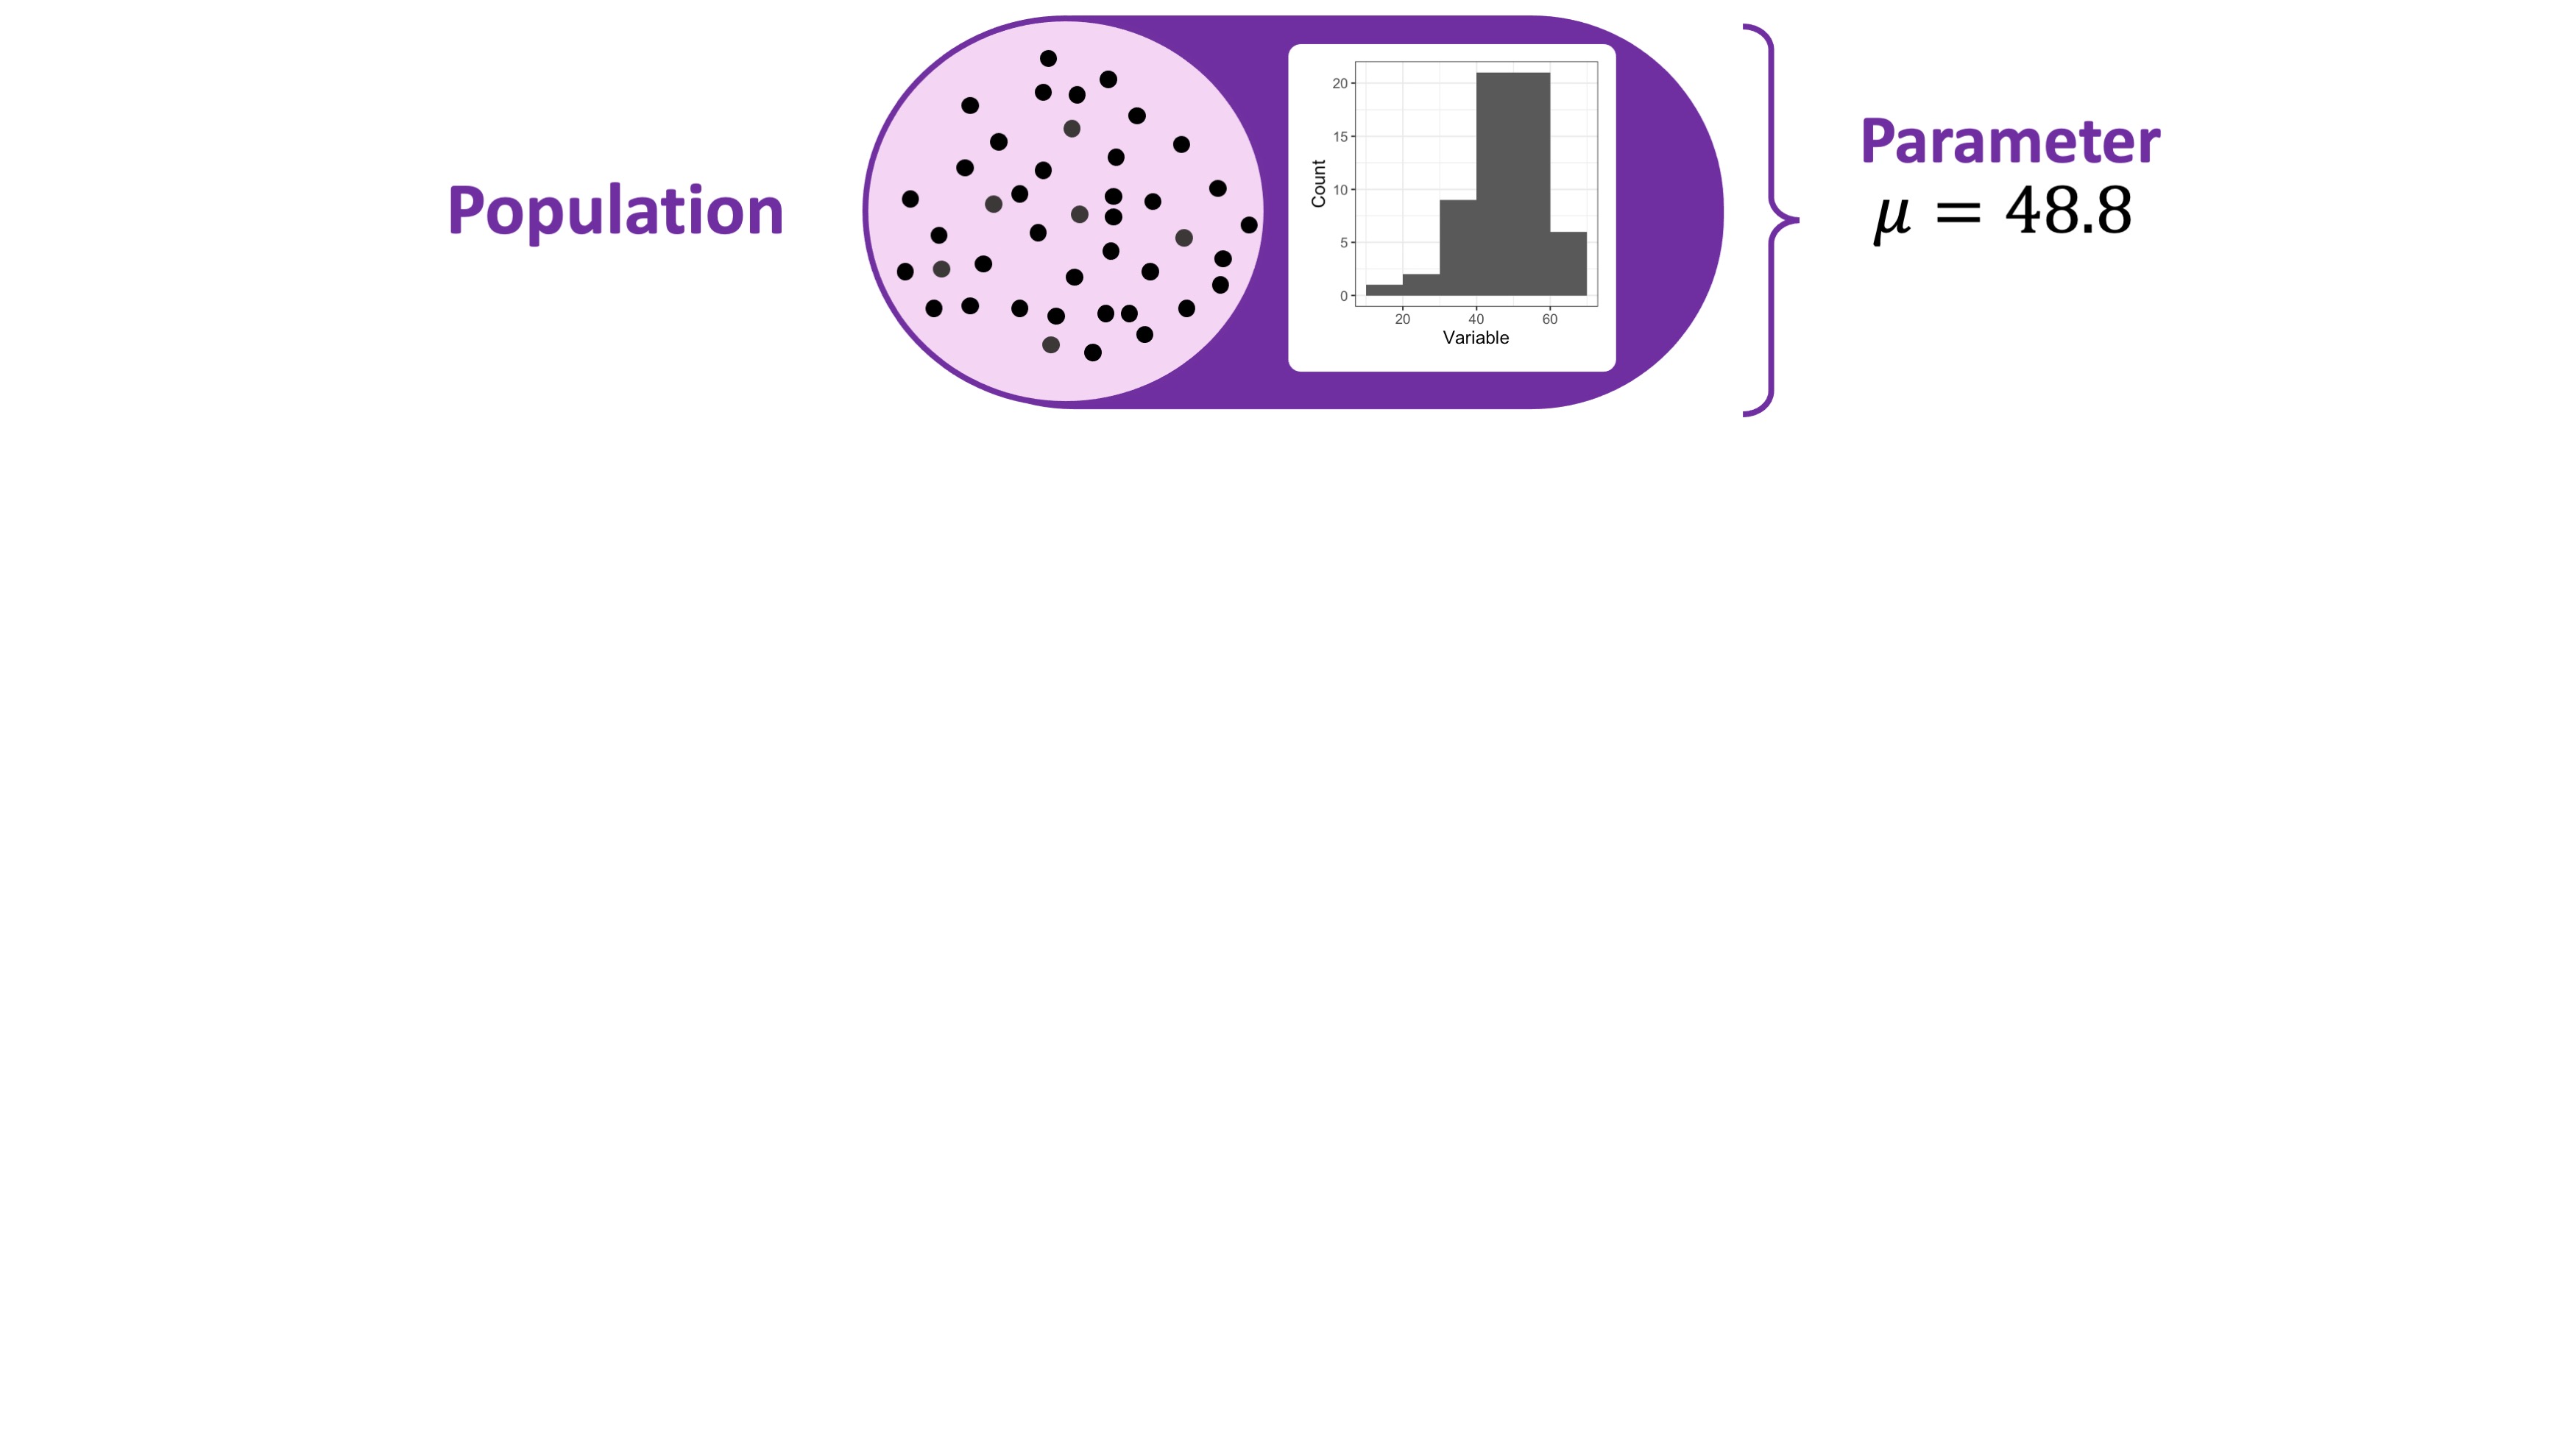
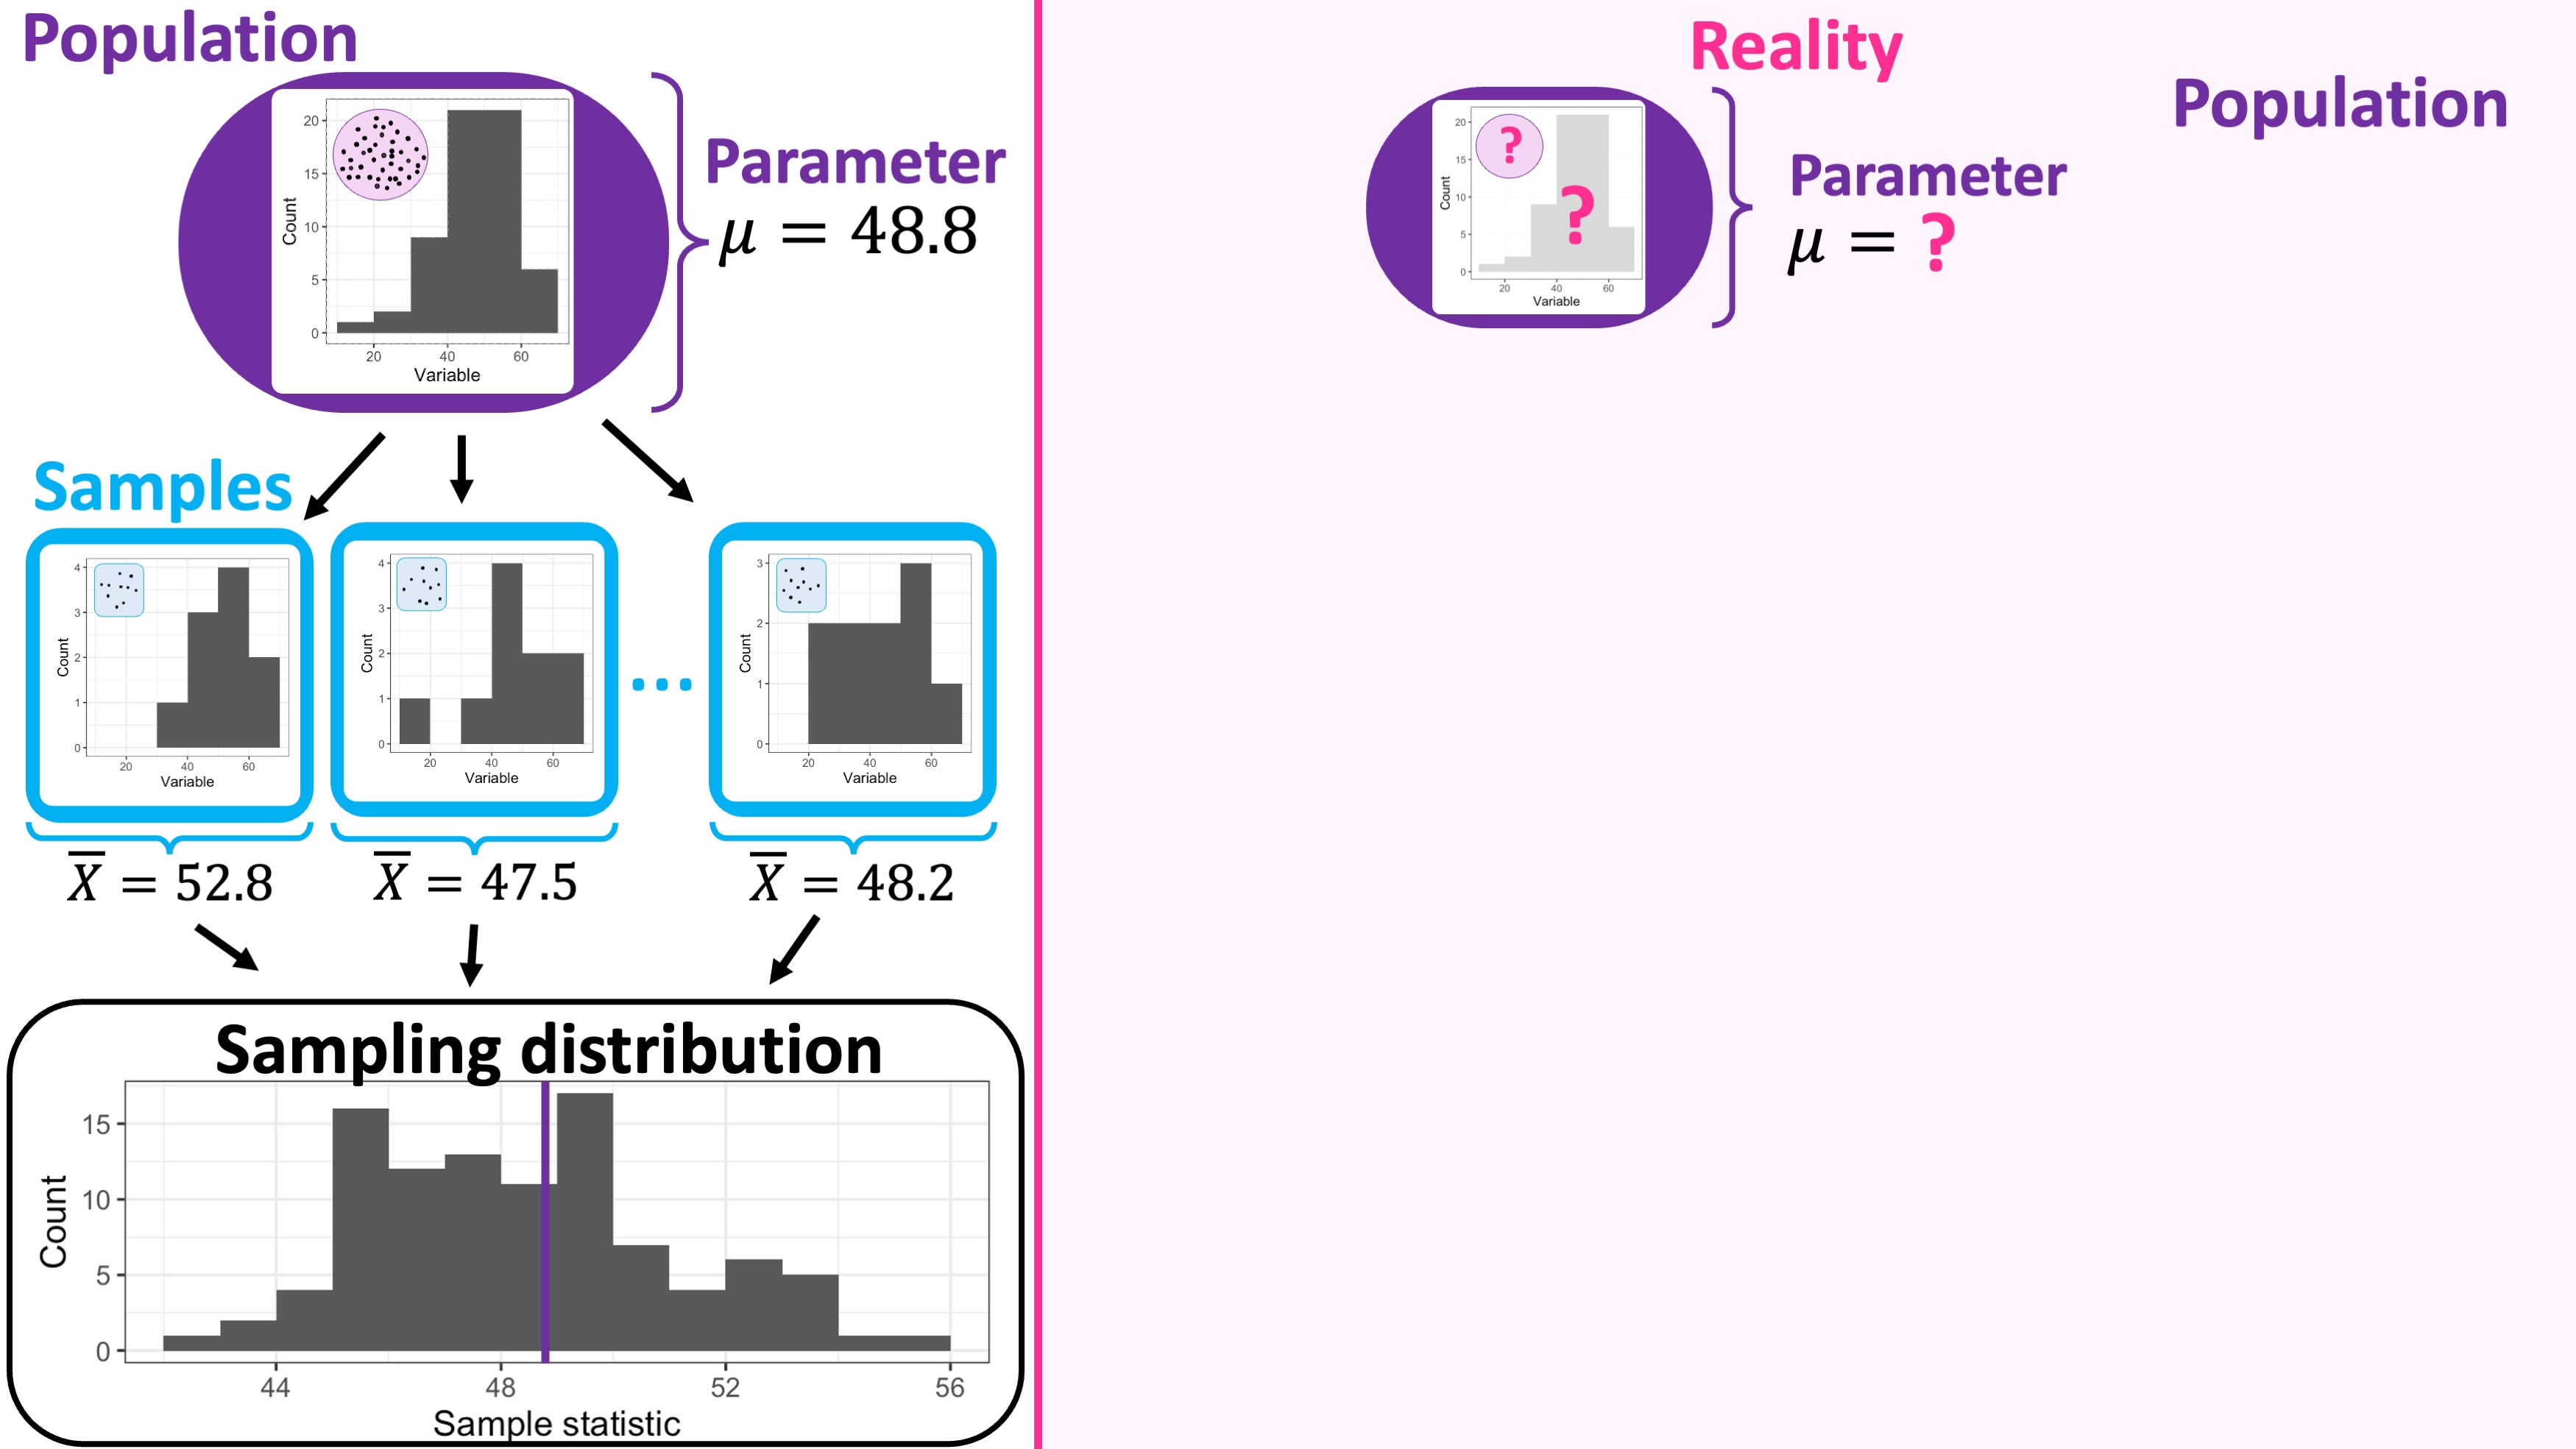
Population
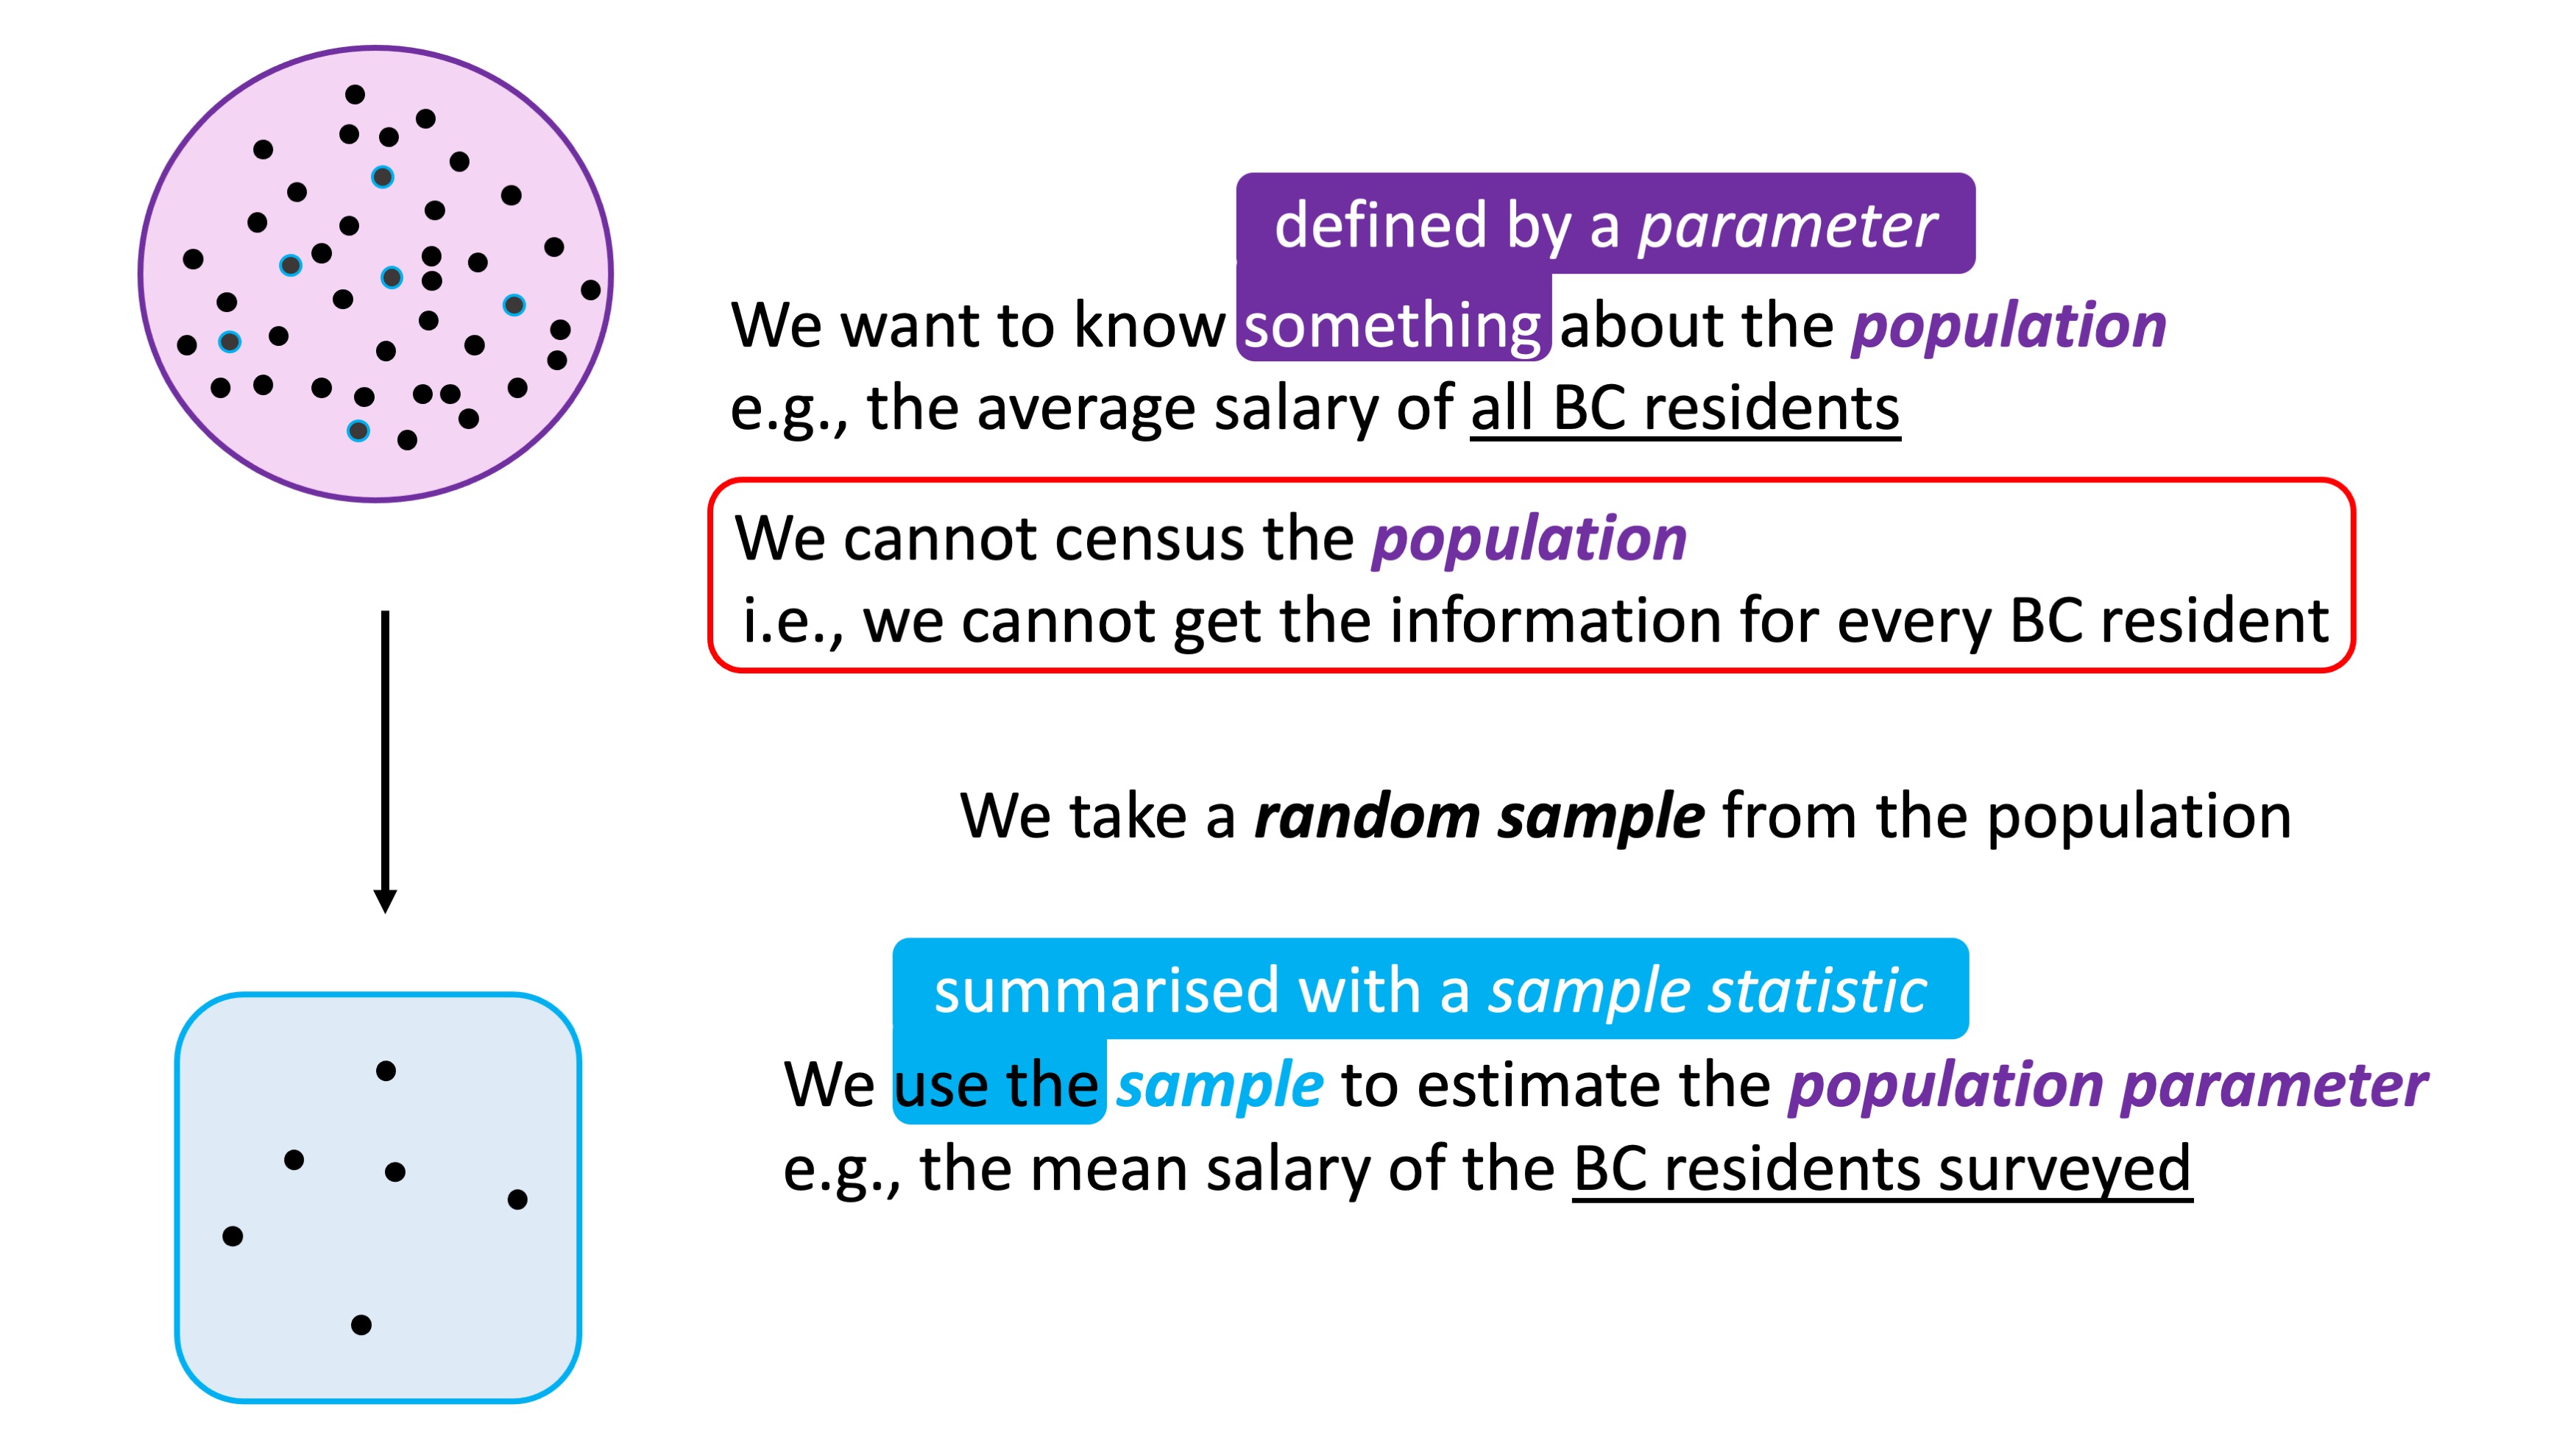
- Population: the group containing all elements you want to study.
- The population is fixed;
- You don’t have access to all elements of the population;
Population Distribution
The population distribution is obtained by measuring all the elements in the population.
The population distribution is unknown!
- remember: we don’t have access to all elements in the population, so we can never get the population distribution.
Parameters
- Parameters: quantities that summarize the population.
- Parameters are fixed but unknown;
- We want to estimate them because they give us useful information about the population;
Sample Concepts
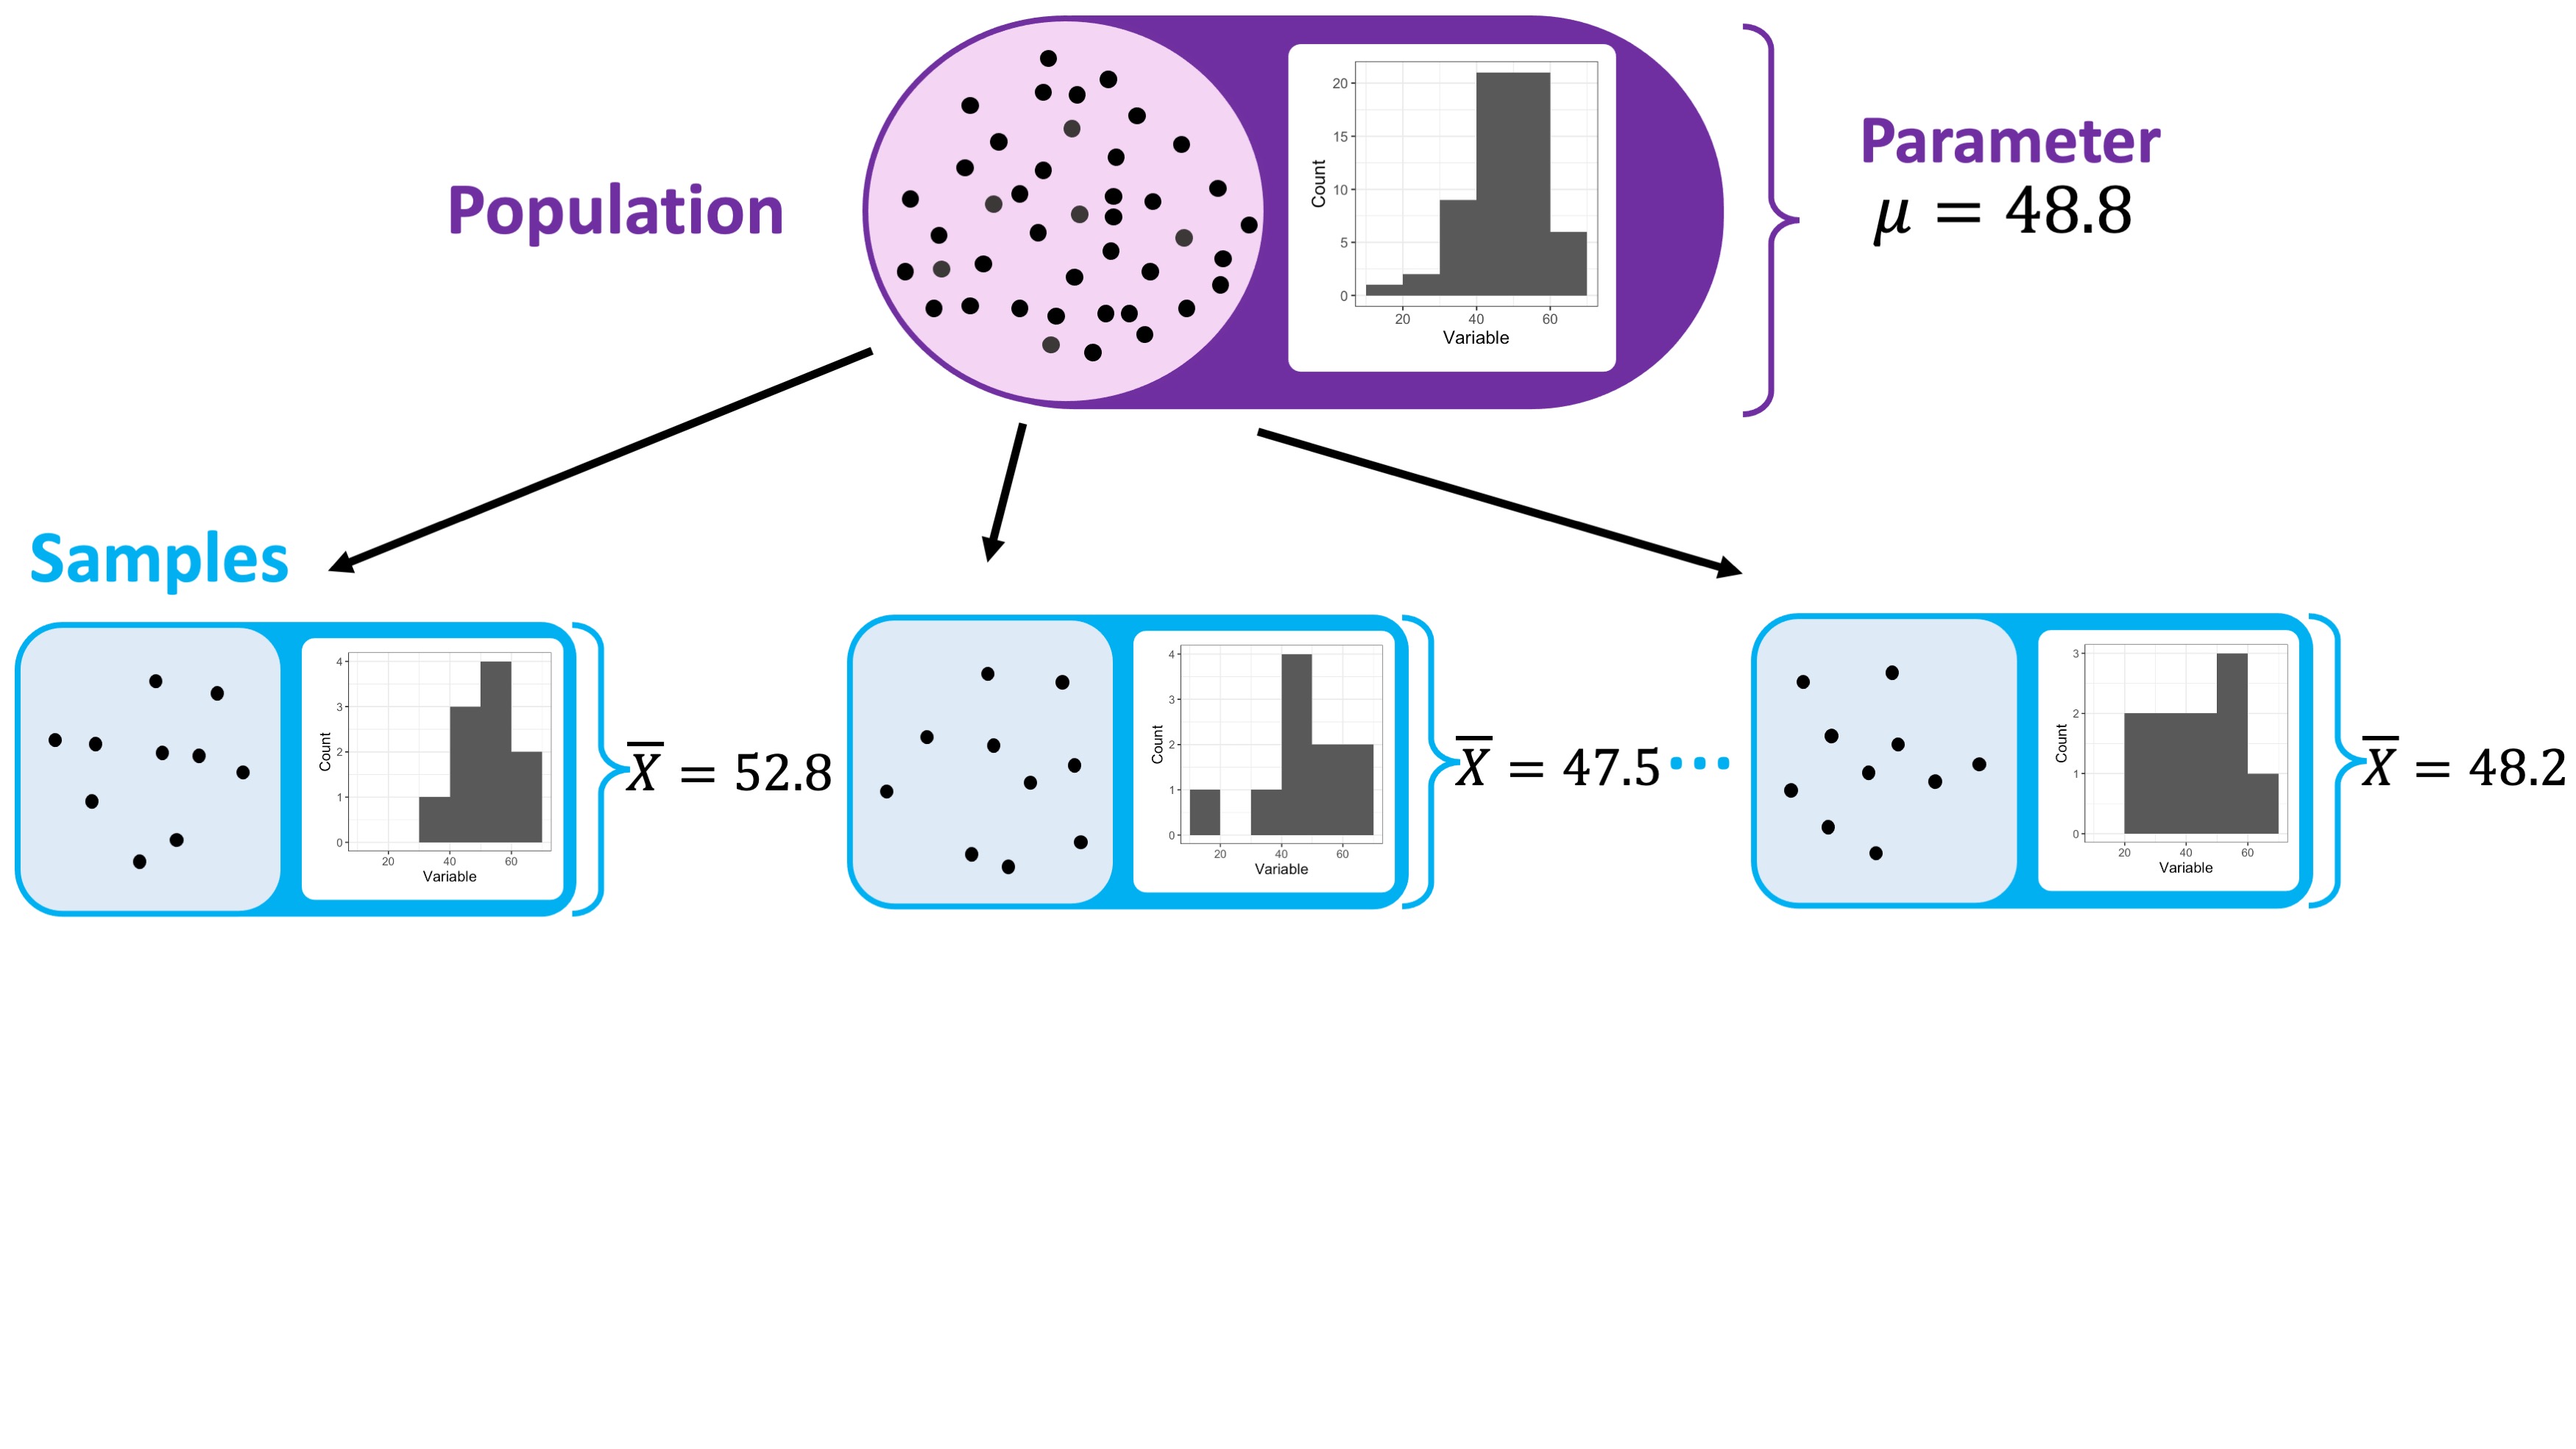
Random Sample
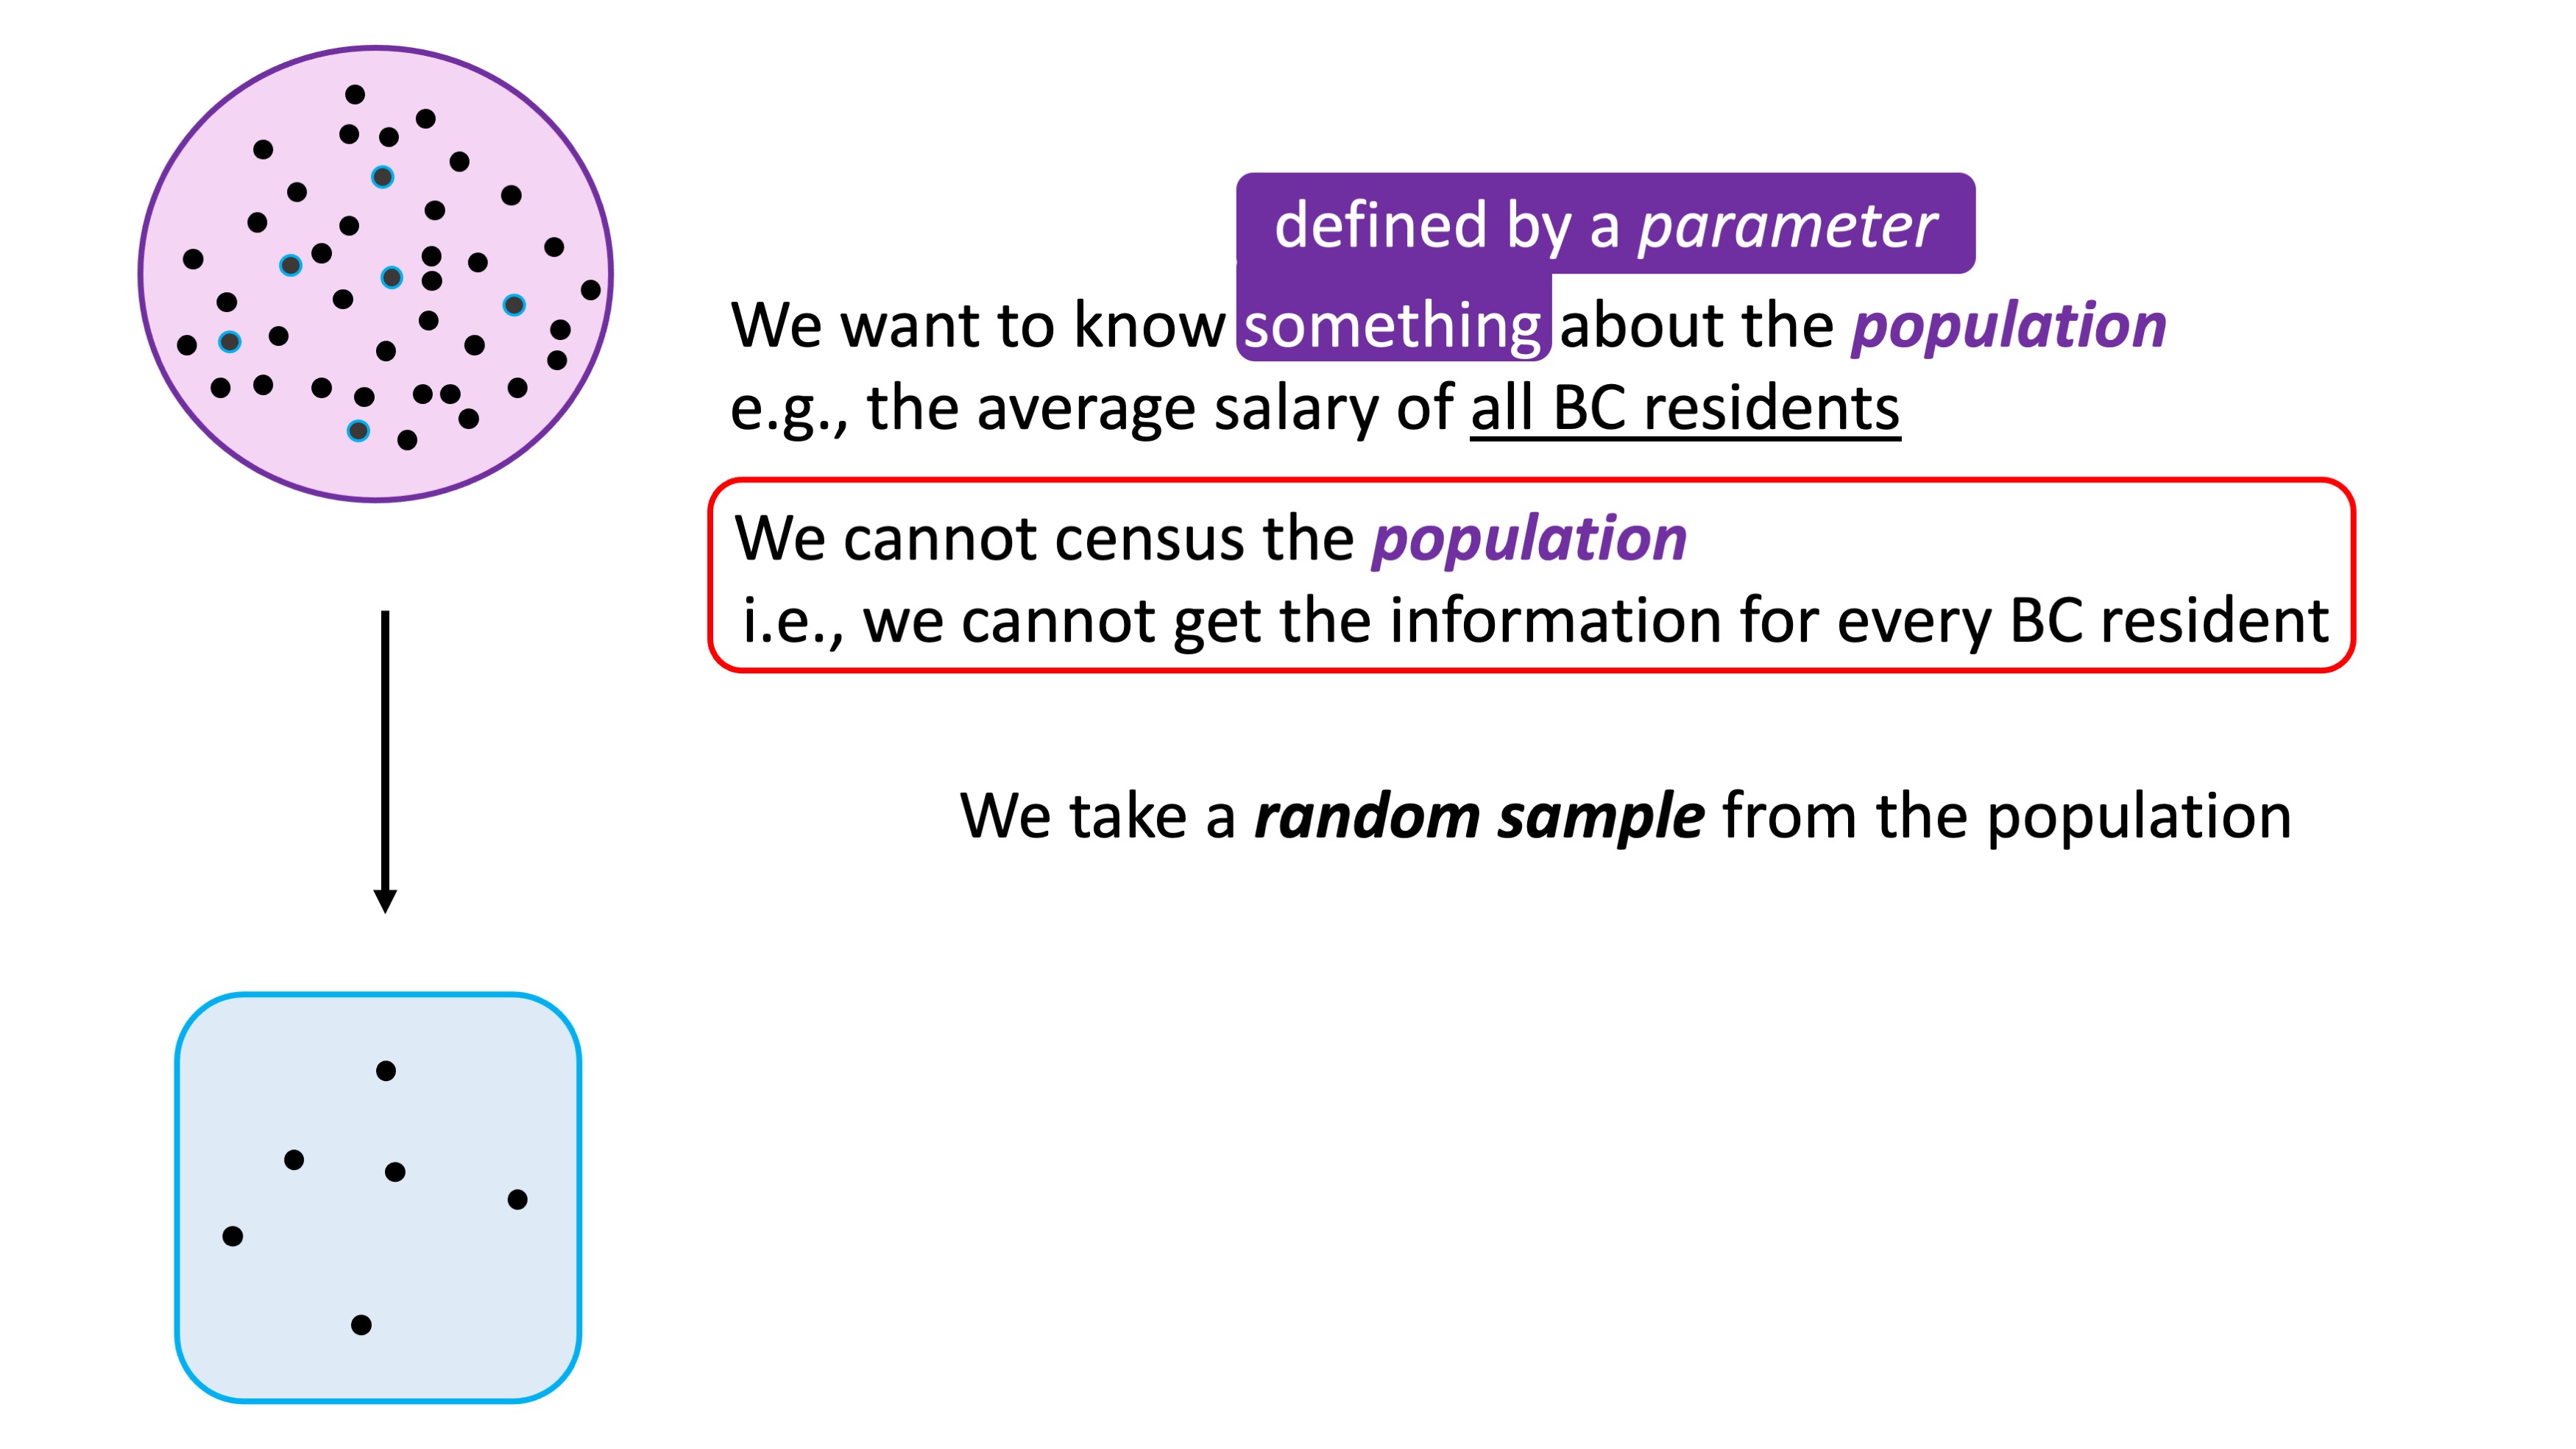
- Random Sample: a subset (part) of the population selected at random
- A random sample is random – changes every time you draw a sample;
- You do have access to all elements of the sample;
Sample Distribution
The sample distribution is obtained by measuring all the elements in the sample.
The sample distribution is known!
We hope that the sample distribution resembles the population distribution;
- remember: we don’t know the population distribution, so we will never know.
Statistics
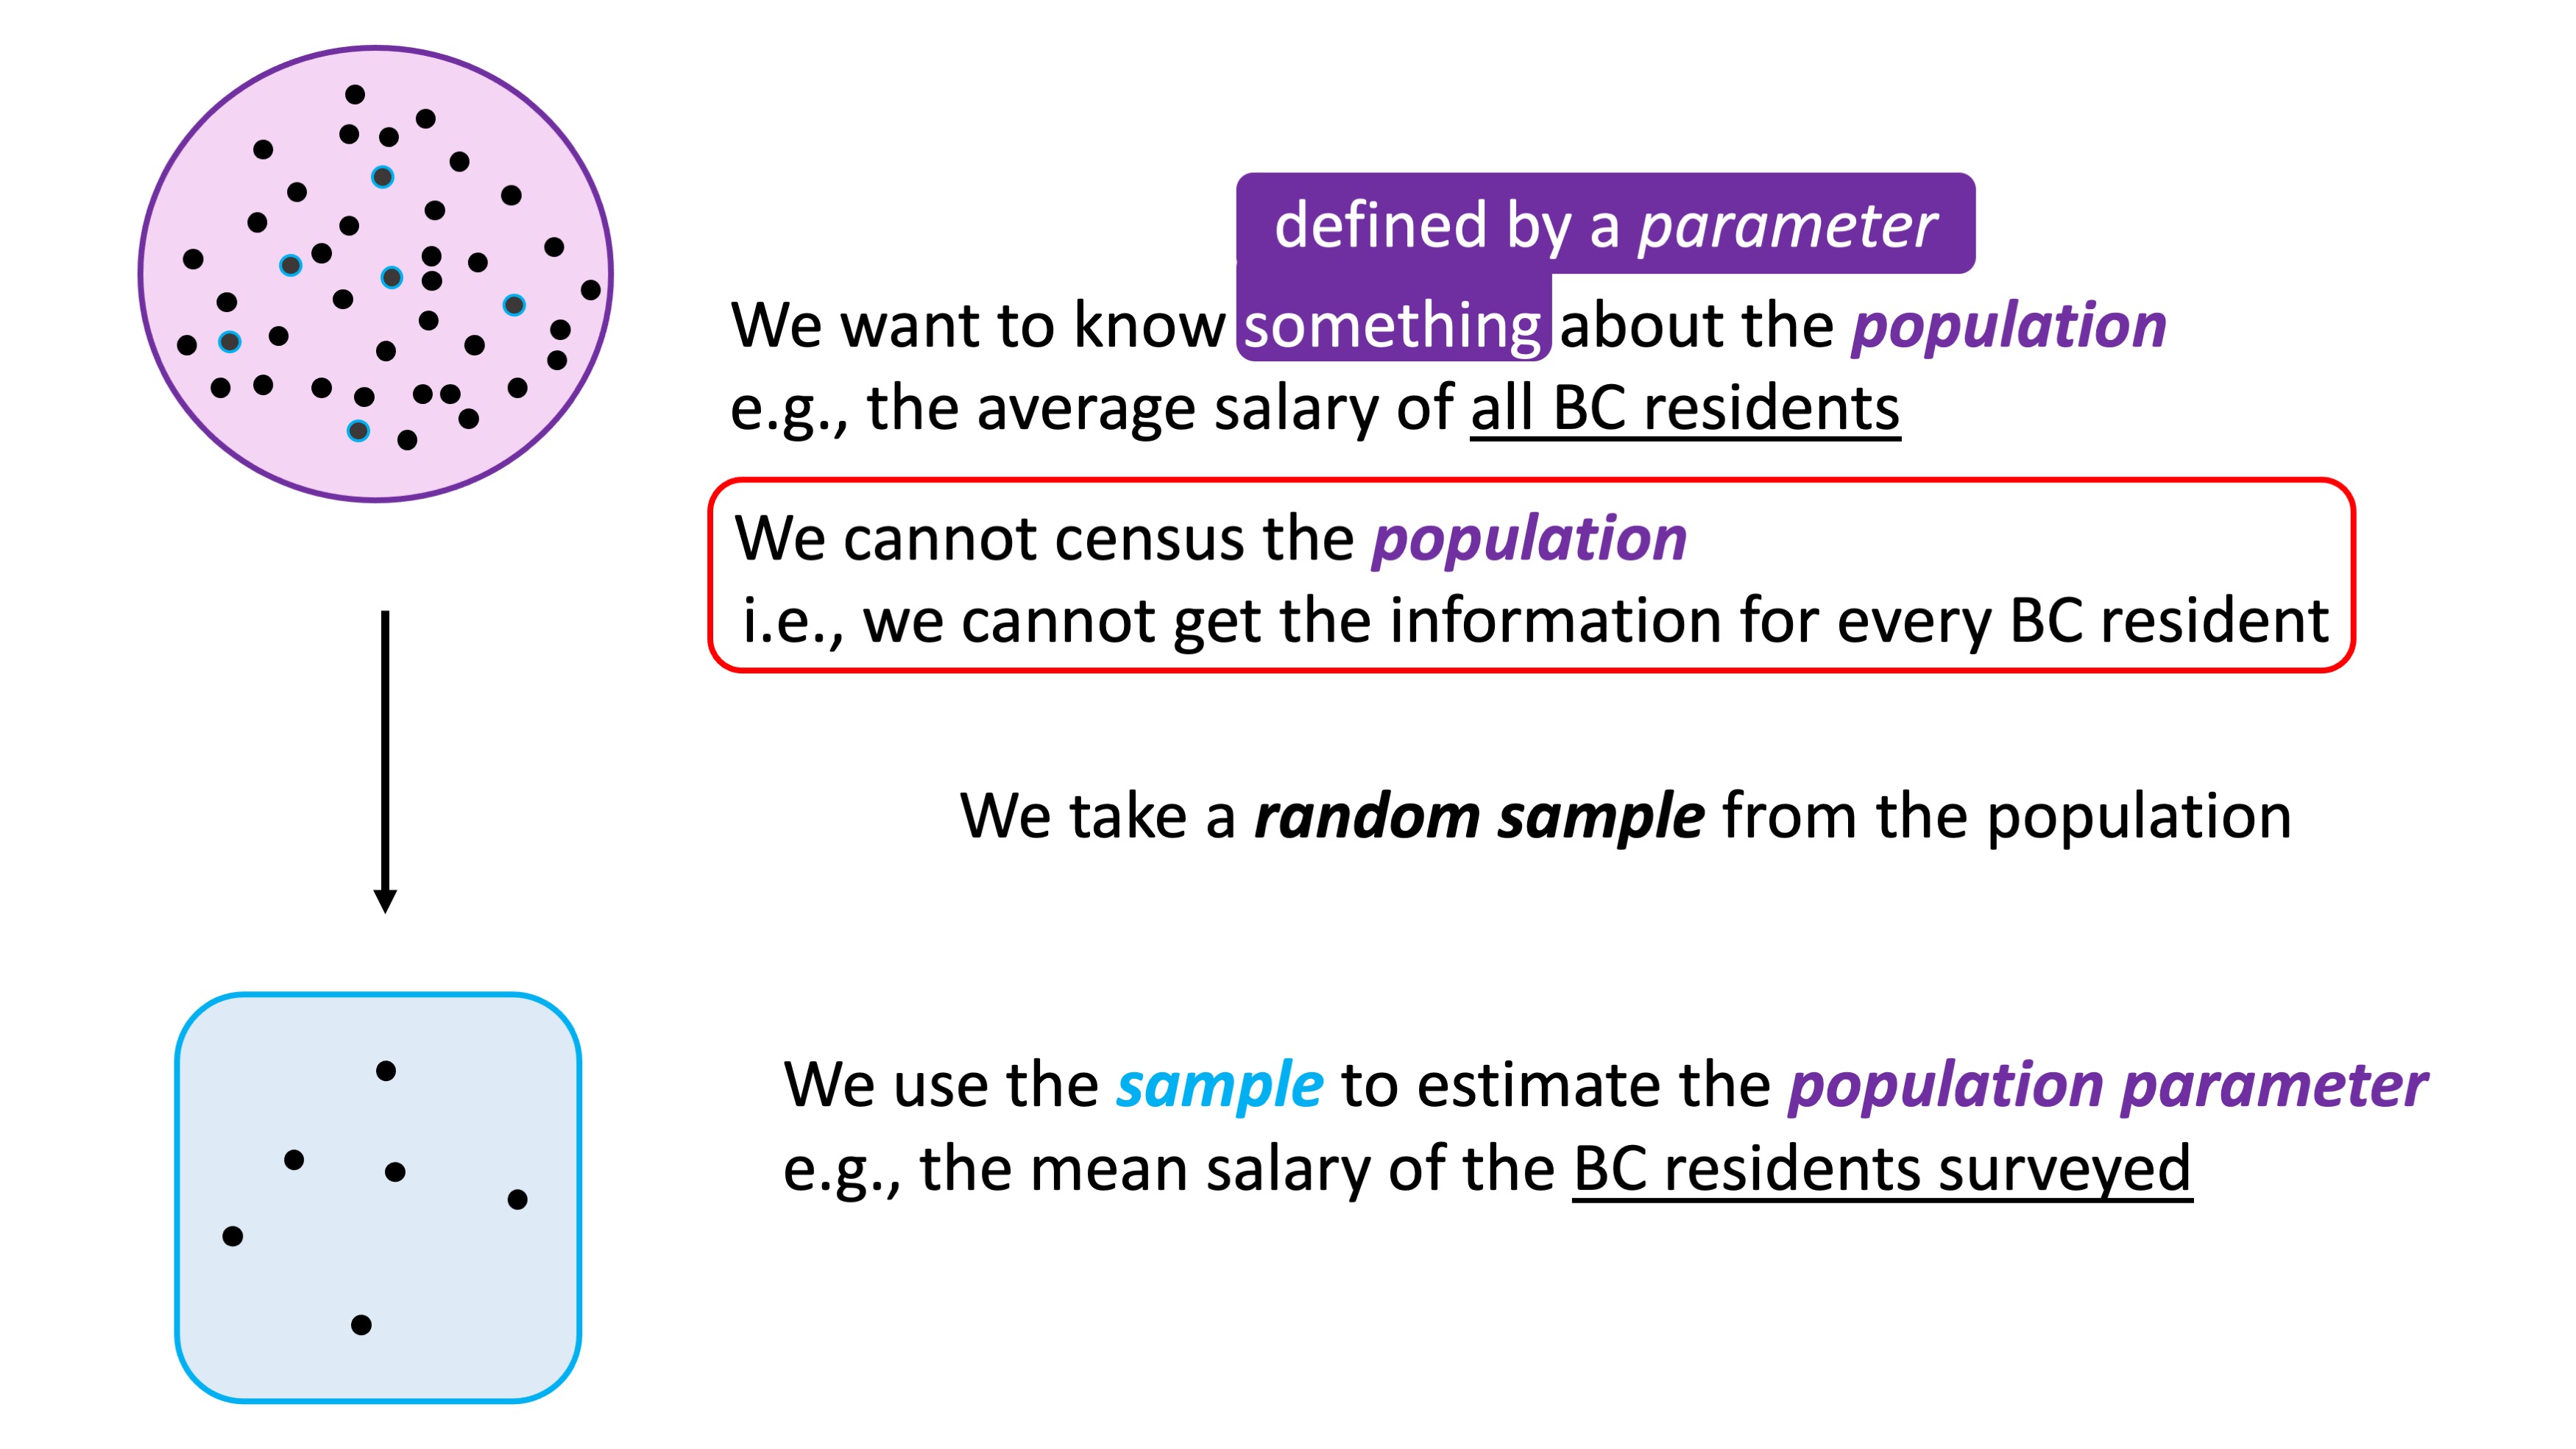
- Statistics: quantities that summarize the sample.
- Samples are random, so statistics are also random;
- We use statistics to estimate unknown population parameters;
emojis = ["female-nurse1", "female-nurse2", "female-nurse3", "male-nurse1",
  "male-nurse2", "female-doc1","female-doc2", "female-doc3", "male-doc1",
  "male-doc2", "female-staff1", "female-staff2", "female-staff3", "male-staff1",
  "male-staff2", "male-staff3"];

// Loading the data
workers = await d3.json("https://ubc-stat.github.io/stat-200/data/workers_data.json");

//calculate the parameters
asc = arr => arr.sort((a, b) => a - b);
sum = arr => arr.reduce((a, b) => a + b, 0);
mean = arr => sum(arr) / arr.length;

/**
 * Computes the sample standard deviation of an array of numbers.
 *
 * @function
 * @param {number[]} arr - An array of numbers for which the sample standard deviation is to be calculated.
 * @returns {number} The sample standard deviation of the input array, rounded to two decimal places.
 *
 * @example
 * std([1, 2, 3, 4, 5]); // Returns 1.58
 * std([10, 20, 30, 40, 50]); // Returns 15.81
 */
std = (arr) => {
    const mu = mean(arr);
    const diffArr = arr.map(a => (a - mu) ** 2);
    return Math.sqrt(sum(diffArr) / (arr.length - 1));
};


/**
 * Computes the q-th quantile of a given array of numbers.
 *
 * @function
 * @param {number[]} arr - An array of numbers for which the quantile is to be calculated.
 * @param {number} q - The quantile to compute, where 0 <= q <= 1. For example, 0.25 represents the first quartile (25th percentile).
 * @returns {number} The calculated quantile value, rounded to two decimal places.
 *
 * @example
 * quantile([1, 2, 3, 4, 5], 0.25); // Returns 2
 * quantile([10, 20, 30, 40, 50], 0.5); // Returns 30
 */
quantile = (arr, q) => {
    const sorted = asc(arr);
    const pos = (sorted.length - 1) * q;
    const base = Math.floor(pos);
    const rest = pos - base;
    if (sorted[base + 1] !== undefined) {
        return sorted[base] + rest * (sorted[base + 1] - sorted[base]);
    } else {
        return sorted[base]
    }
};


pop_mean = mean(workers.map(d => d.income)).toFixed(2);
pop_sd = std(workers.map(d => d.income))
pop_25q = quantile(workers.map(d => d.income), 0.25)
pop_50q = quantile(workers.map(d => d.income), 0.50)
pop_75q = quantile(workers.map(d => d.income), 0.75)
pop_99q = quantile(workers.map(d => d.income), 0.99)


// Filtering data
worker_filtered = {
  const worker_filtered = {
    'female': {
       'nurse': workers.filter(worker => worker.sex == 'female' && worker.job == 'nurse'),
       'staff': workers.filter(worker => worker.sex == 'female' && worker.job == 'staff'),
      'doctor': workers.filter(worker => worker.sex == 'female' && worker.job == 'doctor')
    },
    'male': {
       'nurse': workers.filter(worker => worker.sex == 'male' && worker.job == 'nurse'),
       'staff': workers.filter(worker => worker.sex == 'male' && worker.job == 'staff'),
      'doctor': workers.filter(worker => worker.sex == 'male' && worker.job == 'doctor')
    }
  }

  return worker_filtered;
}


/**
 * Generates a random number from a uniform distribution within a specified range [min, max).
 *
 * @function
 * @param {number} min - The lower bound of the range.
 * @param {number} max - The upper bound of the range.
 * @returns {number} A random number from a uniform distribution within the range [min, max).
 *
 * @example
 * getRandom(1, 5); // Returns a random number between 1 (inclusive) and 5 (exclusive)
 * getRandom(10, 20); // Returns a random number between 10 (inclusive) and 20 (exclusive)
 */
function getRandom(min, max) {
    return Math.random() * (max - min) + min;
}


/**
 * Randomly selects an element from a given array.
 *
 * @function
 * @param {Array} elements - An array of elements from which to select.
 * @returns {*} A randomly selected element from the input array.
 *
 * @example
 * getRandomElement([1, 2, 3, 4, 5]); // Returns one of the numbers from the array
 * getRandomElement(['apple', 'banana', 'cherry']); // Returns one of the strings from the array
 */
function getRandomElement(elements) {
    return elements[Math.floor(getRandom(0, elements.length))];
}


/**
 * Extracts the sex and job information from a given emoji name.
 *
 * @param {string} randomElement - The name of the emoji from which to extract the sex and job information.
 * @returns {string[]} - An array containing the extracted sex ('male' or 'female') and job ('nurse', 'doctor', or 'staff') information.
 *
 * @example
 *
 * extract_sex_job("female_nurse_emoji"); // Outputs: ['female', 'nurse']
 */
function extract_sex_job(randomElement){
  // The ternary operator checks if "female" is included in the name, assigning 'female' to sex if true, and 'male' if false.
  const sex = randomElement.includes("female") ? 'female': 'male';

  let job;
  if (randomElement.includes("nurse")){
    job = 'nurse';
  } else if (randomElement.includes("doc")){
    job = 'doctor'
  } else if (randomElement.includes("staff")){
    job = 'staff'
  }

  // Return the extracted information as an array with two elements: sex and job.
  return [sex, job];
}

console.log(pop_mean);
Example: BC’s Health System
- Suppose we want to know the average income of all workers who work in BC’s hospitals.
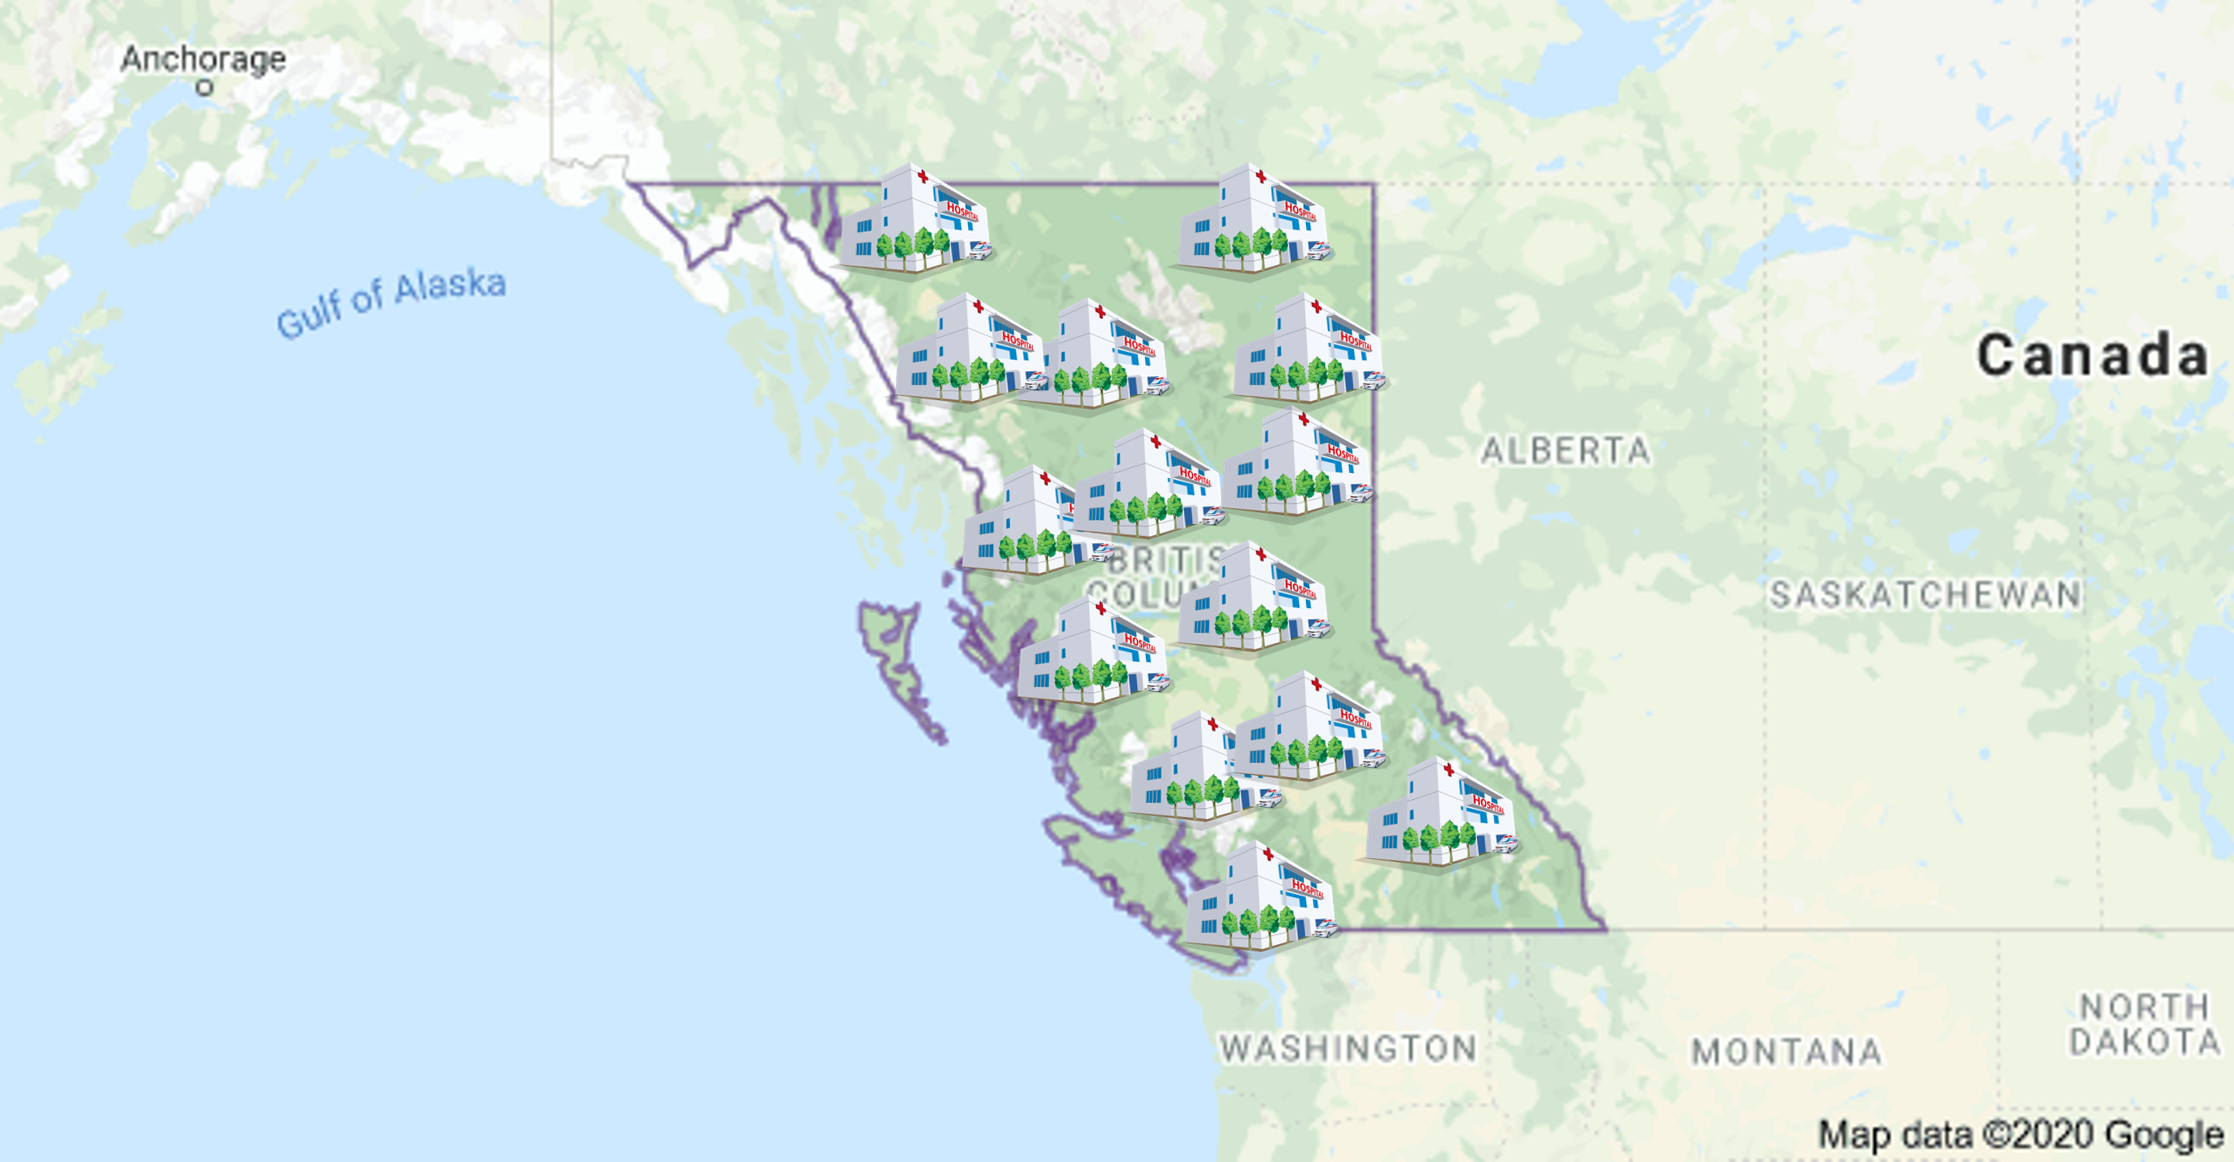
Example: BC’s Health System
- The first thing is to properly define our population;
- part-time workers?
- temporary workers?
- casual workers?
Example: BC’s Health System
Second, the parameter(s) of interest.
What population quantities are you interested in?
- population mean income (\(\mu\))?
- population median income (\(Q_2\))?
- population Std. Dev. (\(\sigma\))?
- Finally, draw a random sample.
Random Sample
You might need to refresh this page to show the plot
Population (\(\mu = ?\))
{
  // This code append the images to the population container.
  const N = 750; // how many images to append
  const div = document.querySelector("#pop-srs1");
  //div.style.height=`${0.10*screen.height}px`;

  for (let i=0; i < N; i++){
     let randomElement = getRandomElement(emojis);
     let img = html`<img src="imgs/${randomElement}.svg" height="45px" width=auto style='position: absolute; left: ${getRandom(0, 90)}%; top: ${getRandom(0, 82)}%; padding:0; margin:0;'></img>`;
     div.append(img);
  }
}{
// Creates the SRS Population Histogram
var margin = {top: 10, right: 10, bottom: 30, left: 25},
width = document.querySelector("#pop-srs1").clientWidth - margin.left - margin.right,
height = 250 - margin.top - margin.bottom;
d3.select("#truth-container")
.append("p")
.text('Population distribution')
.style('font-size', '0.7em')
.style('margin', 0)
// append the svg object to the body of the page
var svg = d3.select("#truth-container")
.append("svg")
.attr("width", width + margin.left + margin.right)
.attr("height", height + margin.top + margin.bottom)
.append("g")
.attr("transform",
"translate(" + margin.left + "," + margin.top + ")");
// X axis: scale and draw:
var x = d3.scaleLinear()
.domain([d3.min(workers, d => d.income), d3.max(workers, d => d.income)])
.range([margin.left, width - margin.right]);
svg.append("g")
.attr("transform", "translate(0," + `${height - margin.bottom}` + ")")
.call(d3.axisBottom(x).tickSizeOuter(0))
.call(g => g.append("text")
.attr("x", width / 2)
.attr("fill", "currentColor")
.attr("font-weight", "bold")
.attr("text-anchor", "bottom")
.attr('font-size', '16px')
.attr("class", "axis")
.attr("dy", "2.5em")
.text("Income (in thousands of $)")
.attr("class","axes-label"));
// set the parameters for the histogram
var histogram = d3.histogram()
.value(d => d.income) // I need to give the vector of value
.domain(x.domain()) // then the domain of the graphic
.thresholds(x.ticks(20)); // then the numbers of bins
// And apply this function to data to get the bins
var bins = histogram(workers);
// Y axis: scale and draw:
var y = d3.scaleLinear()
.range([height - margin.bottom, 0])
.domain([0, d3.max(bins, d => d.length + 100)]); // d3.hist has to be called before the Y axis obviously
svg.append("g")
.attr("transform", `translate(${margin.left},0)`)
.call(d3.axisLeft(y))
.call(g => g.select(".tick:last-of-type text").clone()
.attr("x", -(height - margin.bottom)/2)
.attr("y", -40)
.attr("font-weight", "bold")
.attr('font-size', '16px')
.attr('transform', 'rotate(270)')
.attr("text-anchor", "middle")
.text("Frequency")
.attr("class","axes-label"));
// append the bar rectangles to the svg element
svg.selectAll("rect")
.data(bins)
.enter()
.append("rect")
.attr("x", 1)
.attr("transform", function(d) { return "translate(" + x(d.x0) + "," + y(d.length) + ")"; })
.attr("width", function(d) { return x(d.x1) - x(d.x0) -1 ; })
.attr("height", function(d) { return height - y(d.length) - margin.bottom; })
.style("fill", "steelblue")
d3.select("#truth-container")
.append("p")
.text('A few parameters:')
.style('font-size', '0.7em')
.style('margin', 0)
let ul = d3.select("#truth-container")
.append('ul')
.style('font-size', '0.5em');
ul.append('li')
.text(`Mean: ${pop_mean}`)
.attr("style", 'margin-bottom: 0 !important;');
ul.append('li')
.text(`Median: ${pop_50q}`)
.attr("style", 'margin-bottom: 0 !important;');
ul.append('li')
.text(`0.99-quantile: ${pop_99q}`)
.attr("style", 'margin-bottom: 0 !important;');
ul.append('li')
.text(`Std. Dev.: ${pop_sd}`)
.attr("style", 'margin-bottom: 0 !important;');
ul.append('li')
.text(`IQR: ${Math.round(100*(pop_75q-pop_25q))/100}`)
.attr("style", 'margin-bottom: 0 !important;');
}Sample
function append_sample_element(div, element, fontSize){
  let info_element = extract_sex_job(element);
  let worker = getRandomElement(worker_filtered[info_element[0]][info_element[1]]);
  let img = html`<img src="imgs/${element}.svg" height="45px" width="45px" data-income='${worker.income}' style='margin: 0 auto;'></img>`;

  const container = document.createElement("div");
  let name = html`<div style='margin-left: auto; margin-right:auto; font-size: ${fontSize};'>${worker.first_name}</div>`
  let income = html`<div style='margin-left: auto; margin-right:auto; font-size: ${fontSize};'>$${worker.income}k </div>`

  container.append(name);
  container.append(img);
  container.append(income);

  container.style.fontSize = '0.27em';
  container.style.display = 'flex'
  container.style.flexDirection = 'column';
  container.style.width = '60px';
  container.style.margin = '0';
  container.style.marginBottom = '1px';
  div.append(container);

  return worker;
}

function take_srs(size, div_selector){
  const div = document.querySelector(div_selector);
  div.innerHTML = '';

  let sample_elements = Array(size);
  for (let i=0; i < size; i++){

       let randomElement = getRandomElement(emojis);
       sample_elements[i] = append_sample_element(div, randomElement, '0.95em');
    }

  return sample_elements;
}

selected_elements_srs = take_srs(sample_size_srs1, "#sample-srs1");

srs_mean = Math.round(selected_elements_srs.reduce((partialSum, a) => partialSum + a.income, 0)/selected_elements_srs.length, 2);
{
let sample_size = sample_size_srs1;
// Creates the Histogram
var margin = {top: 10, right: 10, bottom: 30, left: 25},
width = document.querySelector("#pop-srs1").clientWidth - margin.left - margin.right,
height = 200 - margin.top - margin.bottom;
document.querySelector("#sample-dist-srs").innerHTML = '';
d3.select("#sample-dist-srs")
.append("p")
.text('Sample distribution')
.style('font-size', '0.7em')
.style('margin', 0);
var svg = d3.select("#sample-dist-srs")
.append("svg")
.attr("width", width + margin.left + margin.right)
.attr("height", height + margin.top + margin.bottom)
.append("g")
.attr("transform",
"translate(" + margin.left + "," + margin.top + ")");
// X axis: scale and draw:
var x = d3.scaleLinear()
.domain([d3.min(selected_elements_srs, d => d.income-10), d3.max(selected_elements_srs, d => d.income+10)])
.range([margin.left, width - margin.right]);
svg.append("g")
.attr("transform", "translate(0," + `${height - margin.bottom}` + ")")
.call(d3.axisBottom(x).tickSizeOuter(0))
.call(g => g.append("text")
.attr("x", width / 2)
.attr("fill", "currentColor")
.attr("font-weight", "bold")
.attr("text-anchor", "bottom")
.attr('font-size', '16px')
.attr("class", "axis")
.attr("dy", "2.5em")
.text("Income (in thousands of $)")
.attr("class","axes-label"));
// set the parameters for the histogram
var histogram = d3.histogram()
.value(d => d.income) // I need to give the vector of value
.domain(x.domain()) // then the domain of the graphic
.thresholds(x.ticks(20)); // then the numbers of bins
// And apply this function to data to get the bins
var bins = histogram(selected_elements_srs);
// Y axis: scale and draw:
var y = d3.scaleLinear()
.range([height - margin.bottom, 0])
.domain([0, d3.max(bins, d => d.length+10)]); // d3.hist has to be called before the Y axis obviously
svg.append("g")
.attr("transform", `translate(${margin.left},0)`)
.call(d3.axisLeft(y))
.call(g => g.select(".tick:last-of-type text").clone()
.attr("x", -(height - margin.bottom)/2)
.attr("y", -40)
.attr("font-weight", "bold")
.attr('font-size', '16px')
.attr('transform', 'rotate(270)')
.attr("text-anchor", "middle")
.text("Frequency")
.attr("class","axes-label"));
// append the bar rectangles to the svg element
svg.selectAll("rect")
.data(bins)
.enter()
.append("rect")
.attr("x", 1)
.attr("transform", function(d) { return "translate(" + x(d.x0) + "," + y(d.length) + ")"; })
.attr("width", function(d) { return x(d.x1) - x(d.x0) -1 ; })
.attr("height", function(d) { return height - y(d.length) - margin.bottom; })
.style("fill", "steelblue")
.on("mouseenter", (d, i, nodes) => {
// Mouse-over event: turns the bin red and add the number of data points in the bin to the top of the bin
d3.select(d.target).style("fill", "red");
d3.select(d.target.parentNode)
.append("text")
.attr("x", (x(i.x0) + x(i.x1)) / 2)
.attr("text-anchor", "middle")
.attr("y", y(i.length + 1))
.attr("class", "freq")
.attr('font-size', '0.5em')
.text(i.length)
.property("bar", d.target);
d3.select(d.target).style("cursor", "pointer"); // change the cursor
document.getElementById("sample-srs1")
.querySelectorAll("img")
.forEach(entry => {
if (+entry.dataset.income >= d.target.__data__.x0 &&
+entry.dataset.income <= d.target.__data__.x1){
entry.parentNode.style.border = 'solid';
entry.parentNode.style.borderColor = 'red';
}
});
})
.on("mouseout", (d, i, nodes) => {
// Mouse-out event: returns to the original configuration
if (!d.target.flag) {
d3.select(d.target).style("fill", "steelblue")
d3.select(d.target).style("cursor", "default");
d3.selectAll(".freq")
.filter((e, j, texts) => {
return texts[j].bar === d.target;
}).remove();
document.getElementById("sample-srs1")
.querySelectorAll("img")
.forEach(entry => {
if (+entry.dataset.income >= d.target.__data__.x0 &&
+entry.dataset.income <= d.target.__data__.x1){
entry.parentNode.style.border = 'none';
}
});
}
})
d3.select("#sample-dist-srs")
.append("p")
.text('A few statistics:')
.style('font-size', '0.7em')
.style('margin', 0)
let srs_mean = mean(selected_elements_srs.map(d => d.income)).toFixed(2);
let srs_sd = std(selected_elements_srs.map(d => d.income)).toFixed(2);
let srs_25q = quantile(selected_elements_srs.map(d => d.income), 0.25).toFixed(2);
let srs_50q = quantile(selected_elements_srs.map(d => d.income), 0.50).toFixed(2);
let srs_75q = quantile(selected_elements_srs.map(d => d.income), 0.75).toFixed(2);
let srs_99q = quantile(selected_elements_srs.map(d => d.income), 0.99).toFixed(2);
let ul = d3.select("#sample-dist-srs").append('ul');
ul.append('li')
.text(`Mean: ${srs_mean}`)
.attr("style", 'margin-bottom: 0 !important;');
ul.append('li')
.text(`Median: ${srs_50q}`)
.attr("style", 'margin-bottom: 0 !important;');
ul.append('li')
.text(`0.99-quantile: ${srs_99q}`)
.attr("style", 'margin-bottom: 0 !important;');
ul.append('li')
.text(`Std. Dev.: ${srs_sd}`)
.attr("style", 'margin-bottom: 0 !important;');
ul.append('li')
.text(`IQR: ${Math.round((srs_75q - srs_25q) * 100) / 100}`)
.attr("style", 'margin-bottom: 0 !important;');
ul.style('font-size', '0.5em')
.style('margin', 0);
}Exercise
- Use the previous slides to investigate the following questions:
- What happens to the statistics when a new sample is taken?
- What happens to the parameters when a new sample is taken?
- Contrast the Sample Distribution with the Population Distribution for small and large sample sizes. What do you notice?
A note on Sampling and statistical inference
Independence
The inferential methods we will be discussing make a “strong” assumption that our sample is independent.
Independent sample: the selection of one element does not influence the selection of another.
When taking a sample we can do it with or without replacement.
Sampling with Replacement
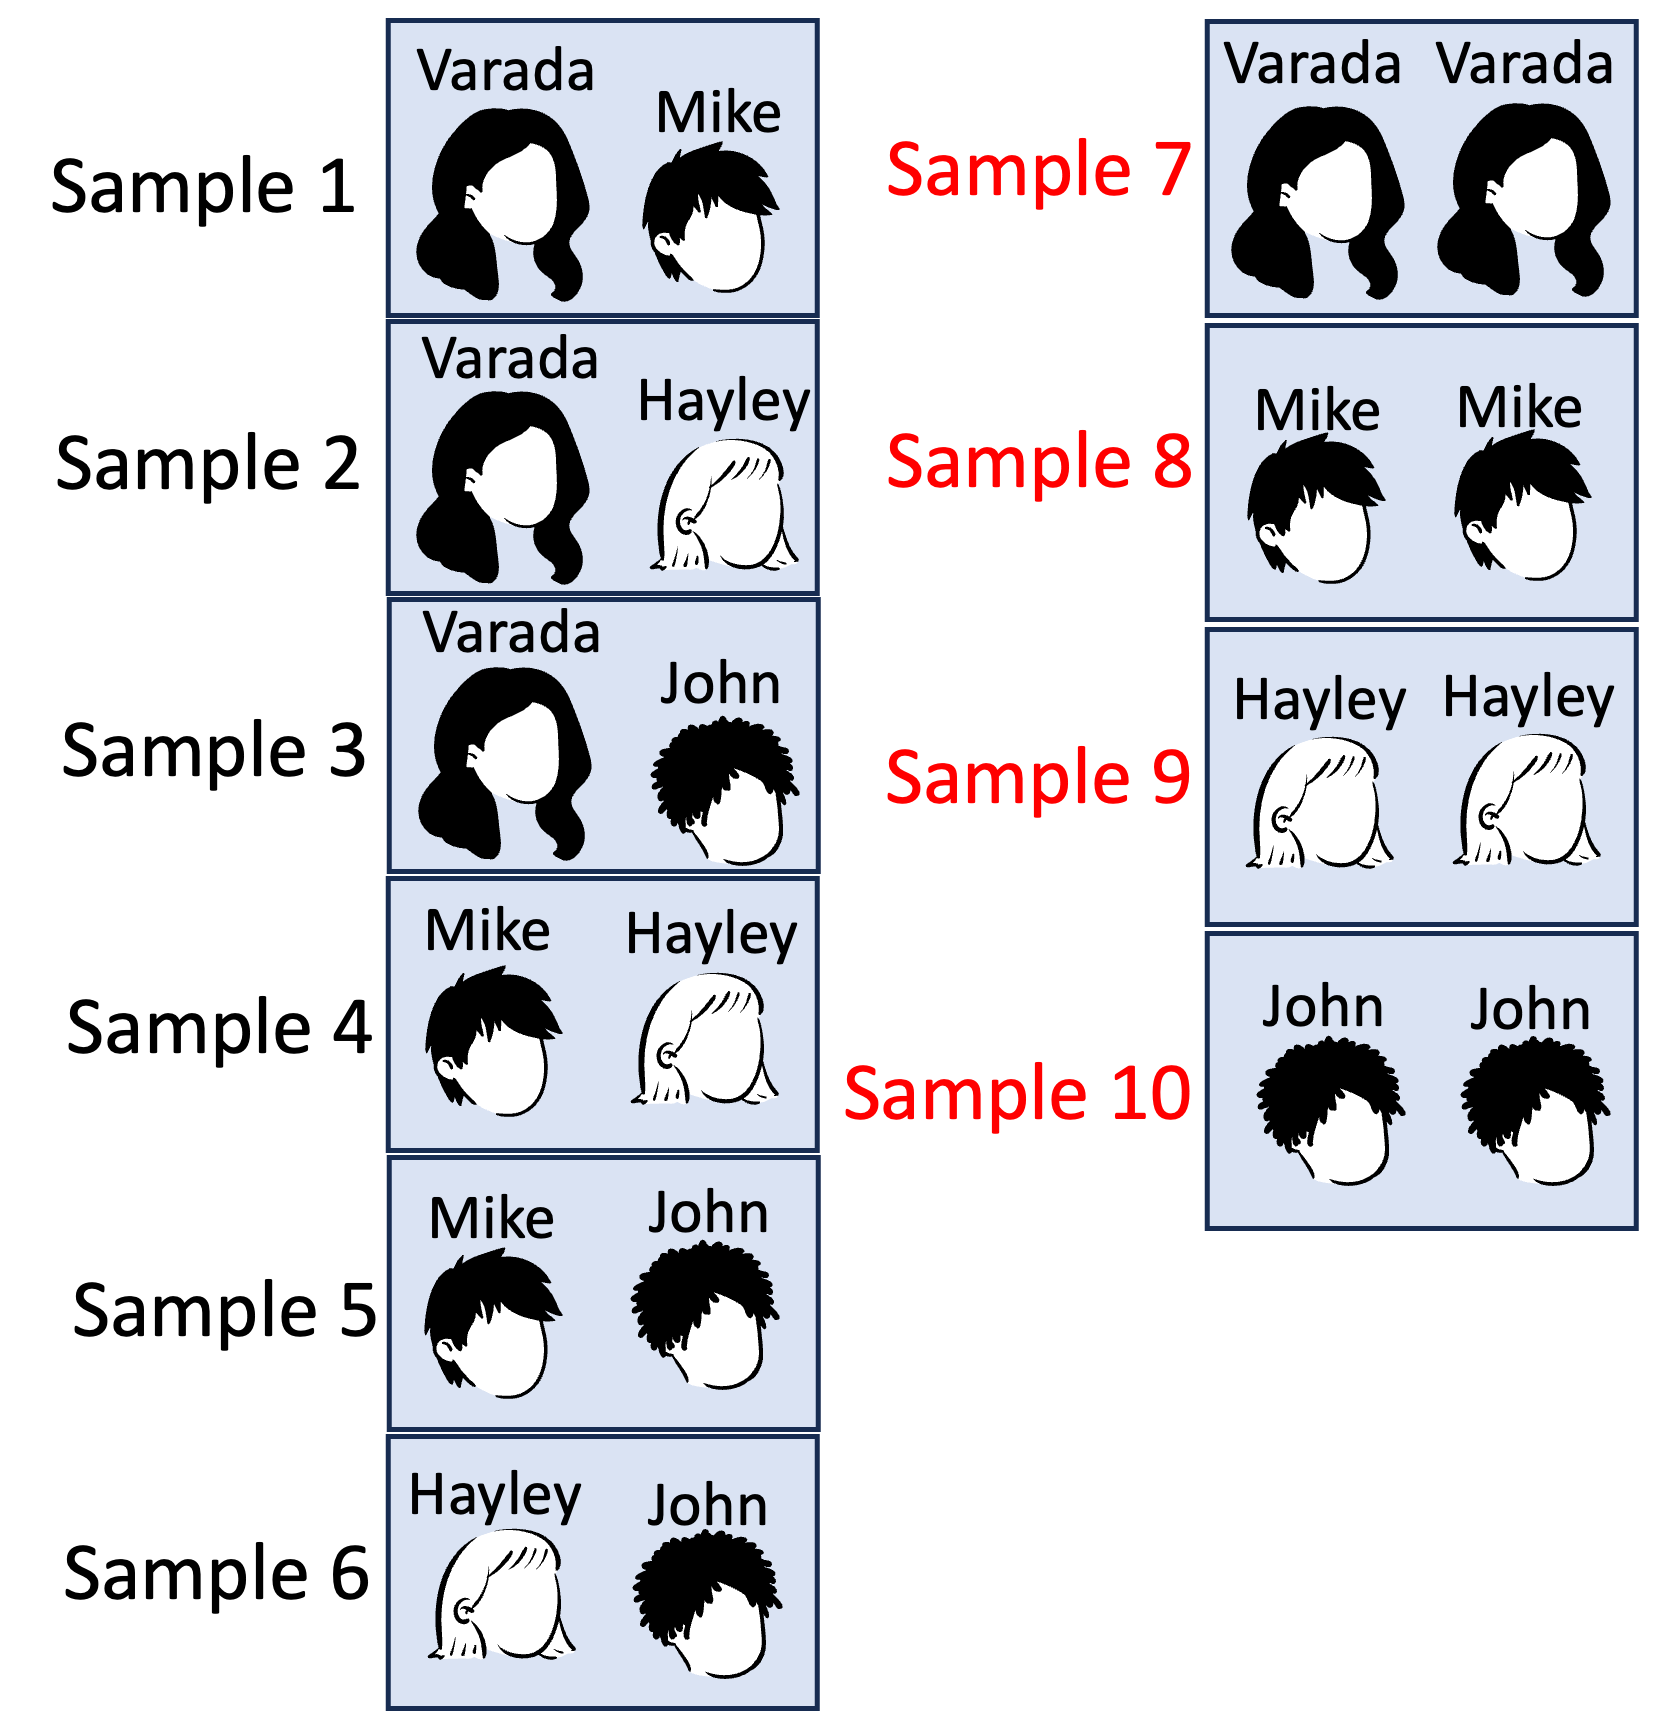
- Sampling with replacement: this approach allows repeated elements in our sample.
- select one element from the population.
- put the element back in the population.
- do Steps 1 and 2 \(n\) times.
Sampling without Replacement
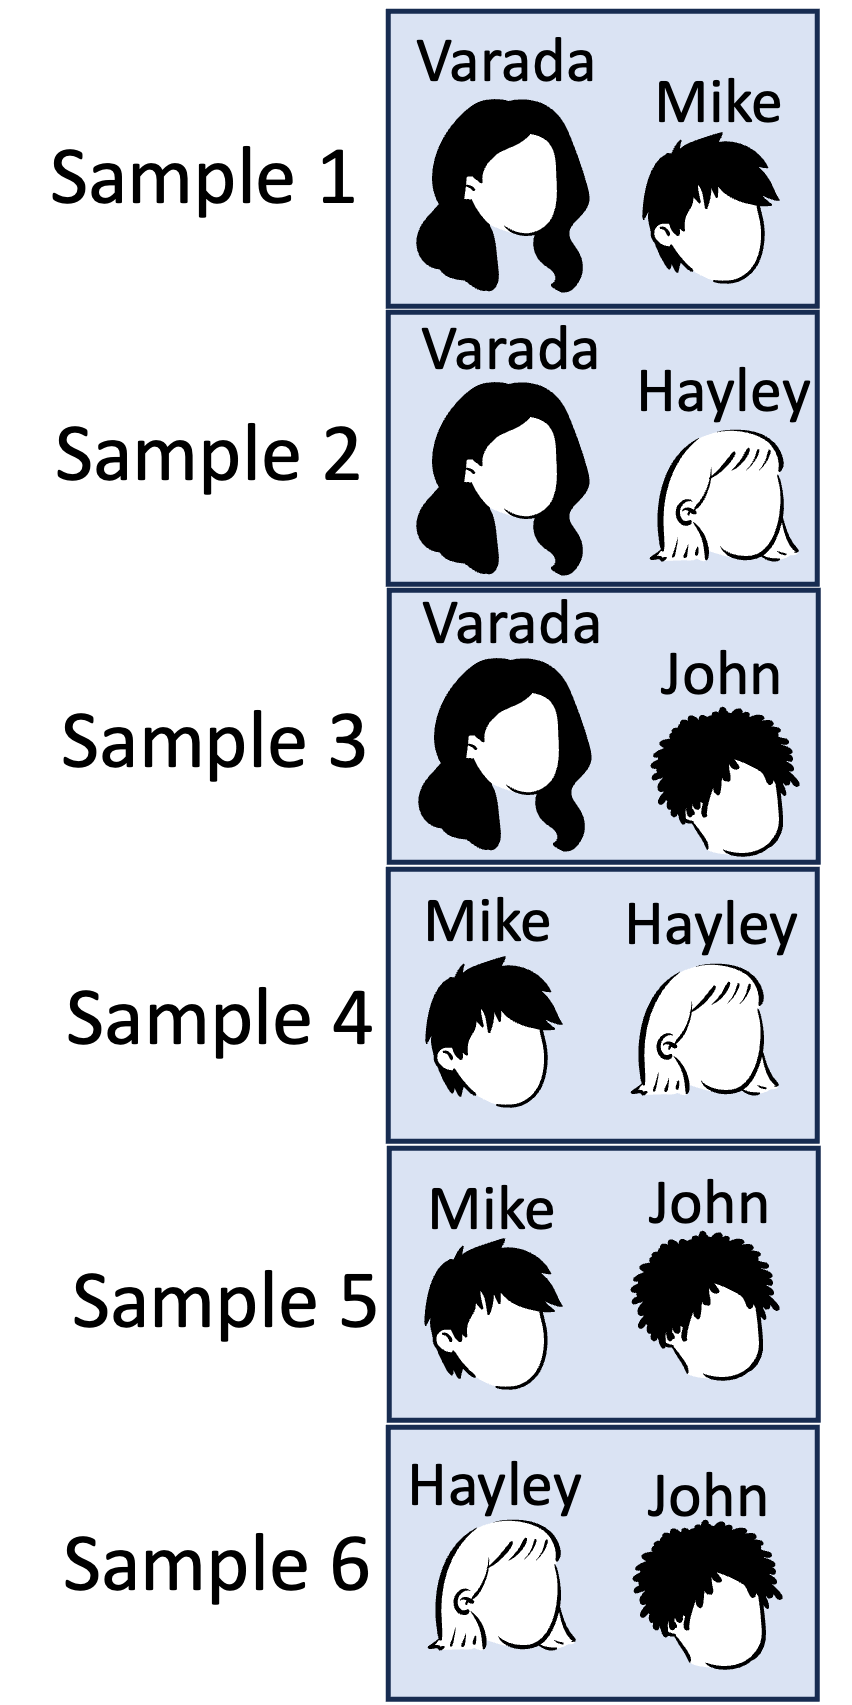
- Sampling without replacement: this approach does not allow repeated elements in our sample.
- select one element from the population.
- remove the element from the population.
- do Steps 1 and 2 \(n\) times.
Example
- Suppose we have a group of 4 people: Varada, Mike, John, and Hayley.
- We want to take a sample of size 2.
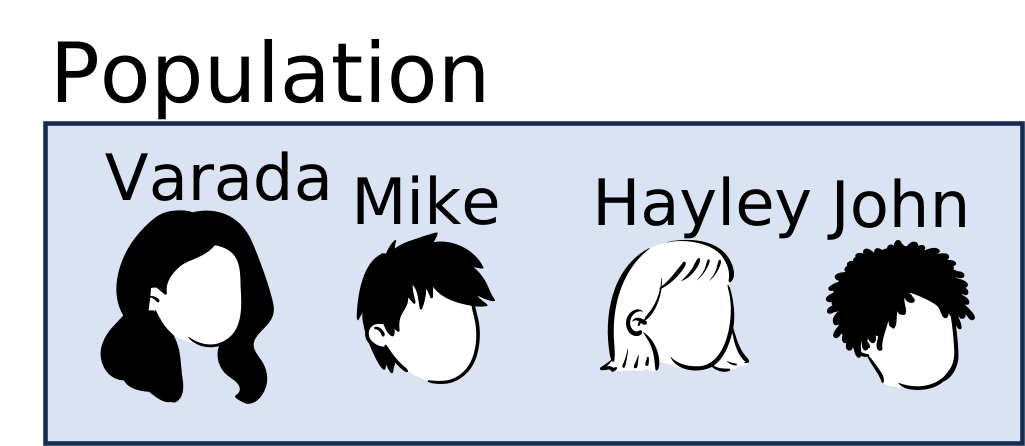
Sampling without Replacement
Possible Samples:
Sampling with Replacement
Possible Samples:
With vs Without Replacement - Part I
- If we select the same element twice, we select repeated information and learn nothing new.
- Sampling without replacement is more informative, meaning that our parameter estimates will be more precise.
- You might be asking yourself why we would ever want to use SRS with replacement.
- Answer: independence!
With vs Without Replacement - Part II
- Unfortunately, sampling without replacement does not yield independent sampling.
- The first elements you pick will affect the chances of the elements you will pick later.
Example: Violation of Independence
- Imagine you have a box with six balls, three reds and three blacks.
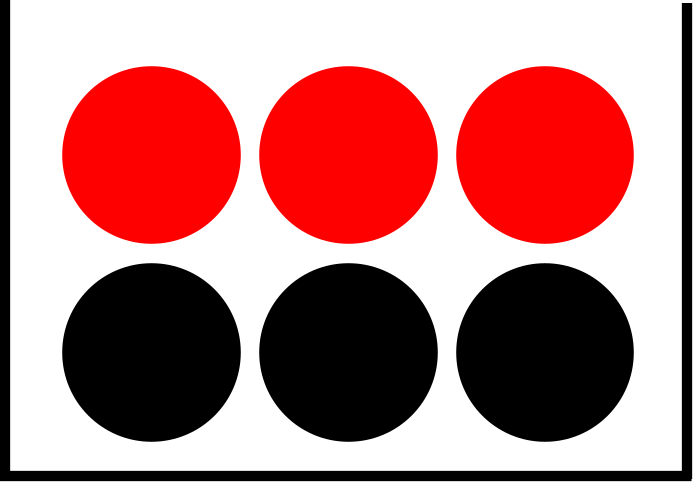
- Say you will take a sample of size 3.
Example: Violation of independence
- Imagine, you have a box with six balls, three reds and three blacks.
- Say you will take a sample of size 3.
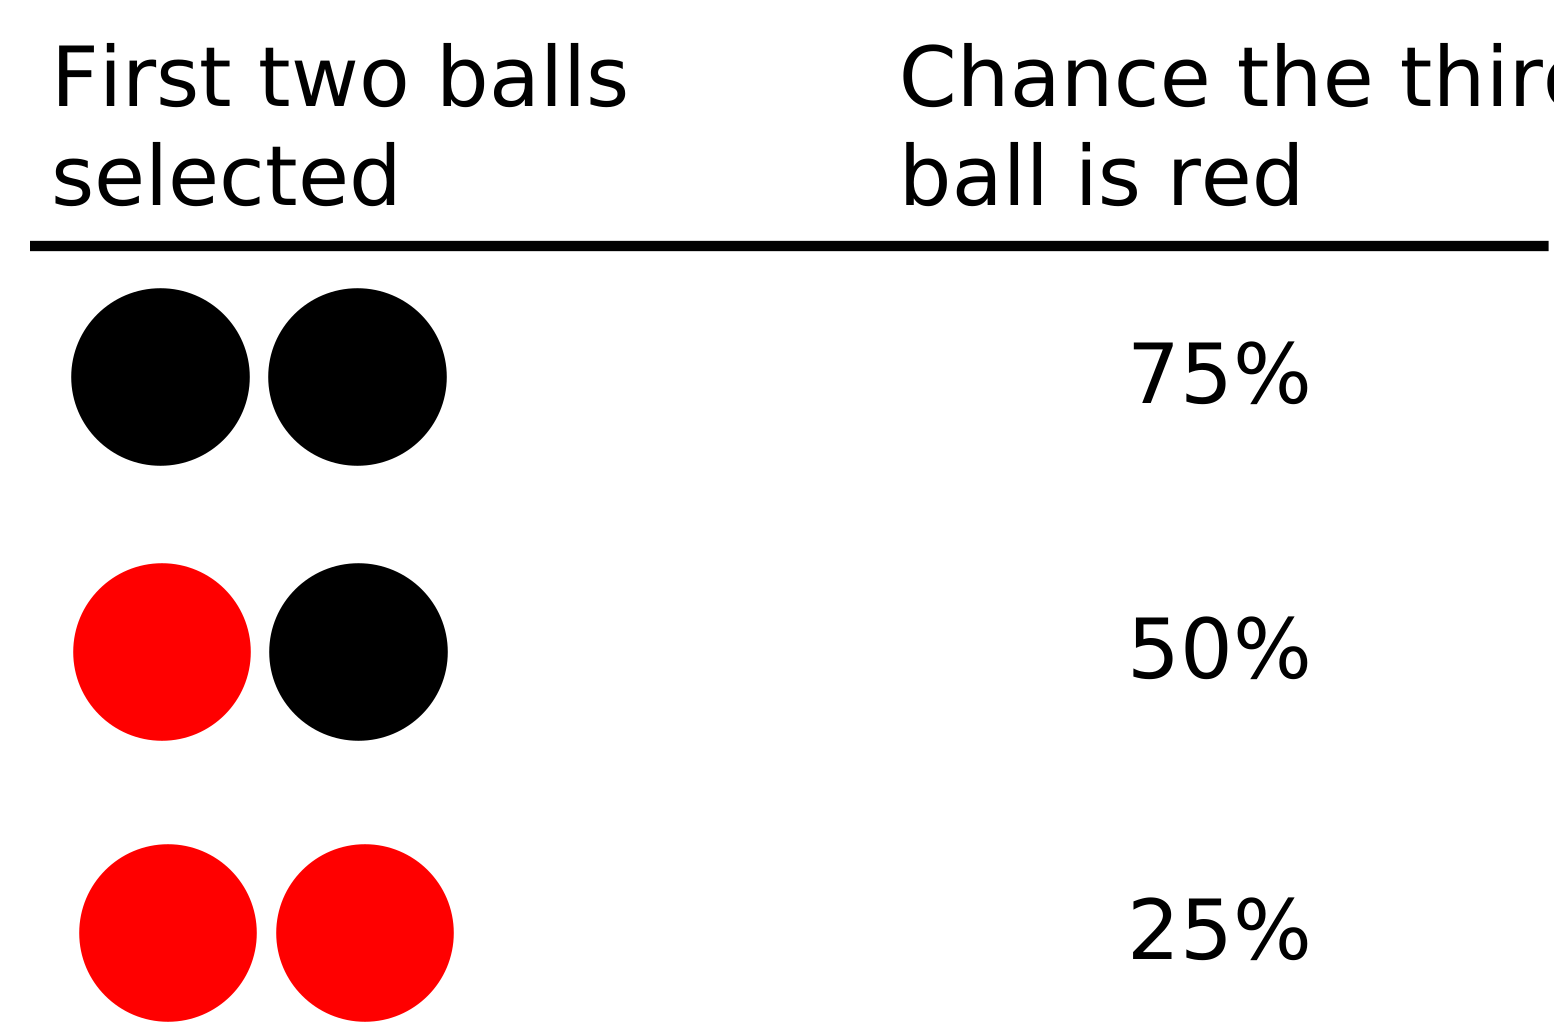
- The chance of the third ball depends on the previous balls: not independent!!
Large populations and small samples
Luckily, if the population is very large compared to the sample size, the independence violation is minimal;
Imagine if the box had five thousand red balls and five thousand black balls.
Say you will take a sample of size 3.
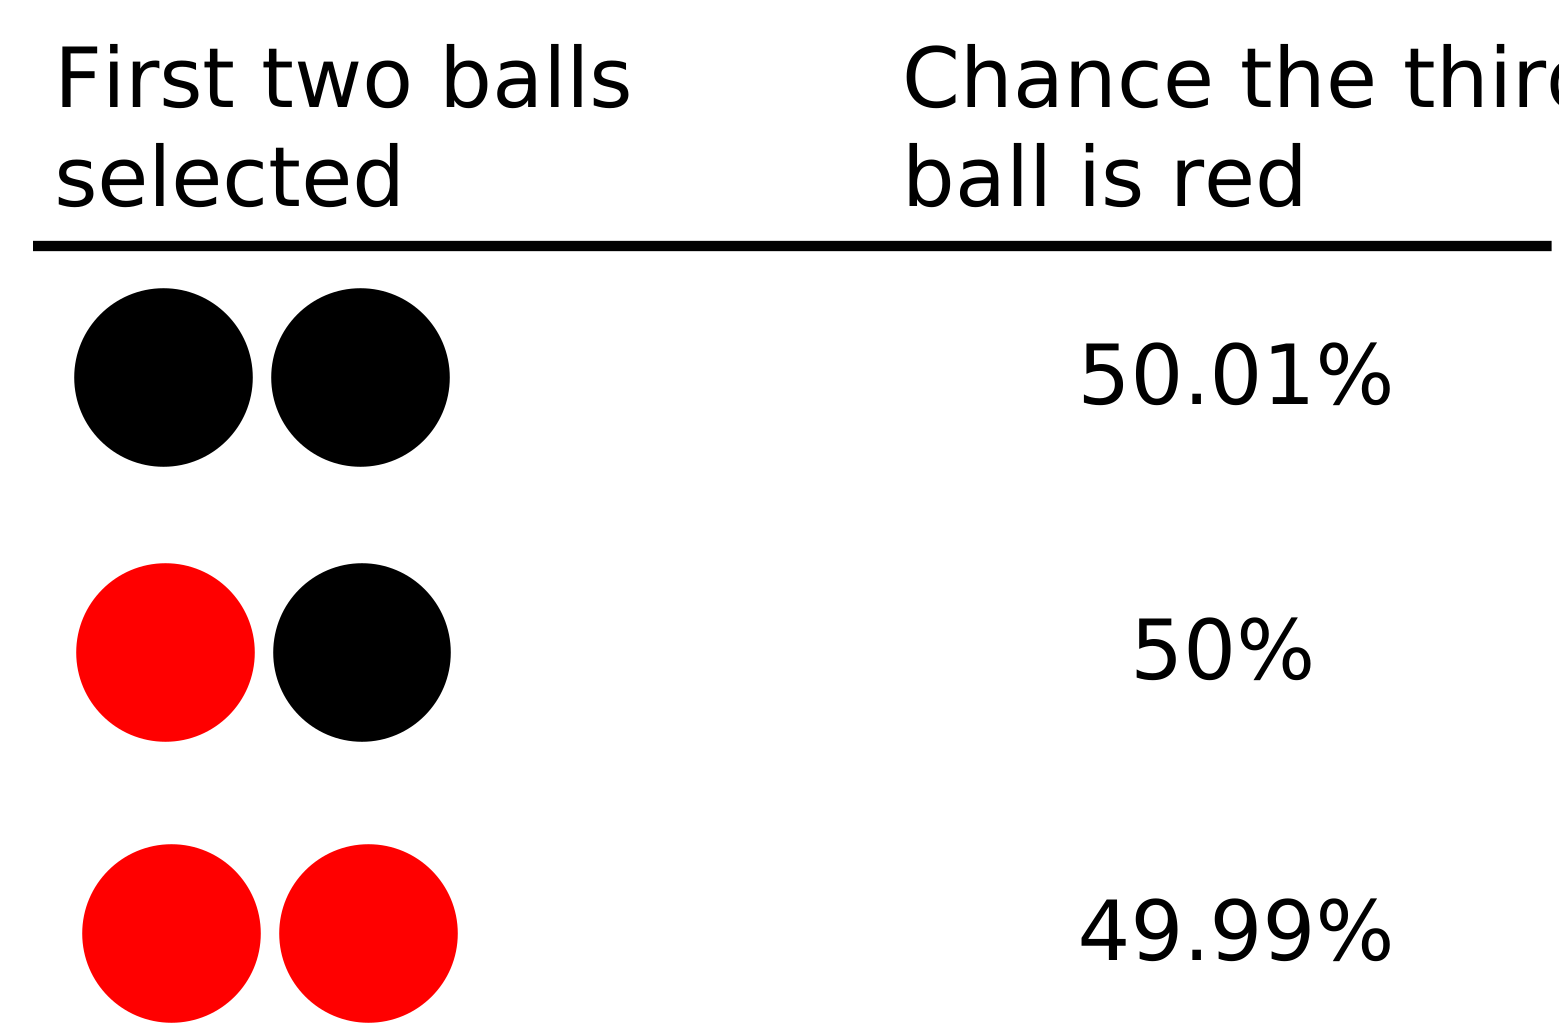
- It is still not independent, but it is “almost independent” (meaning the violation is very tiny).
- In these cases, the assumption of independence is reasonable, and we are in the game.
- Rule of thumb: the sample size at most 10% of the population size.
Pros, cons, and use
Sampling with replacement
- Pros:
- Independent sample
- selection of an element doesn’t influence the selection of other elements
- Independent sample
- Cons:
- Less informative (repeated information)
- Use: Bootstrapping
- Note: Variability even when the sample is the same size as the population
Sampling without replacement
Pros:
- More informative (less repeated information)
- more precise parameter estimate
- More informative (less repeated information)
Cons:
- Dependence
- elements picked affect the chance of the elements you will pick later
- less problematic when sample is small compare to population
- Dependence
Use: sampling the population
Note: No variability if the sample is the same size as the population.
Review: Parameter Estimation
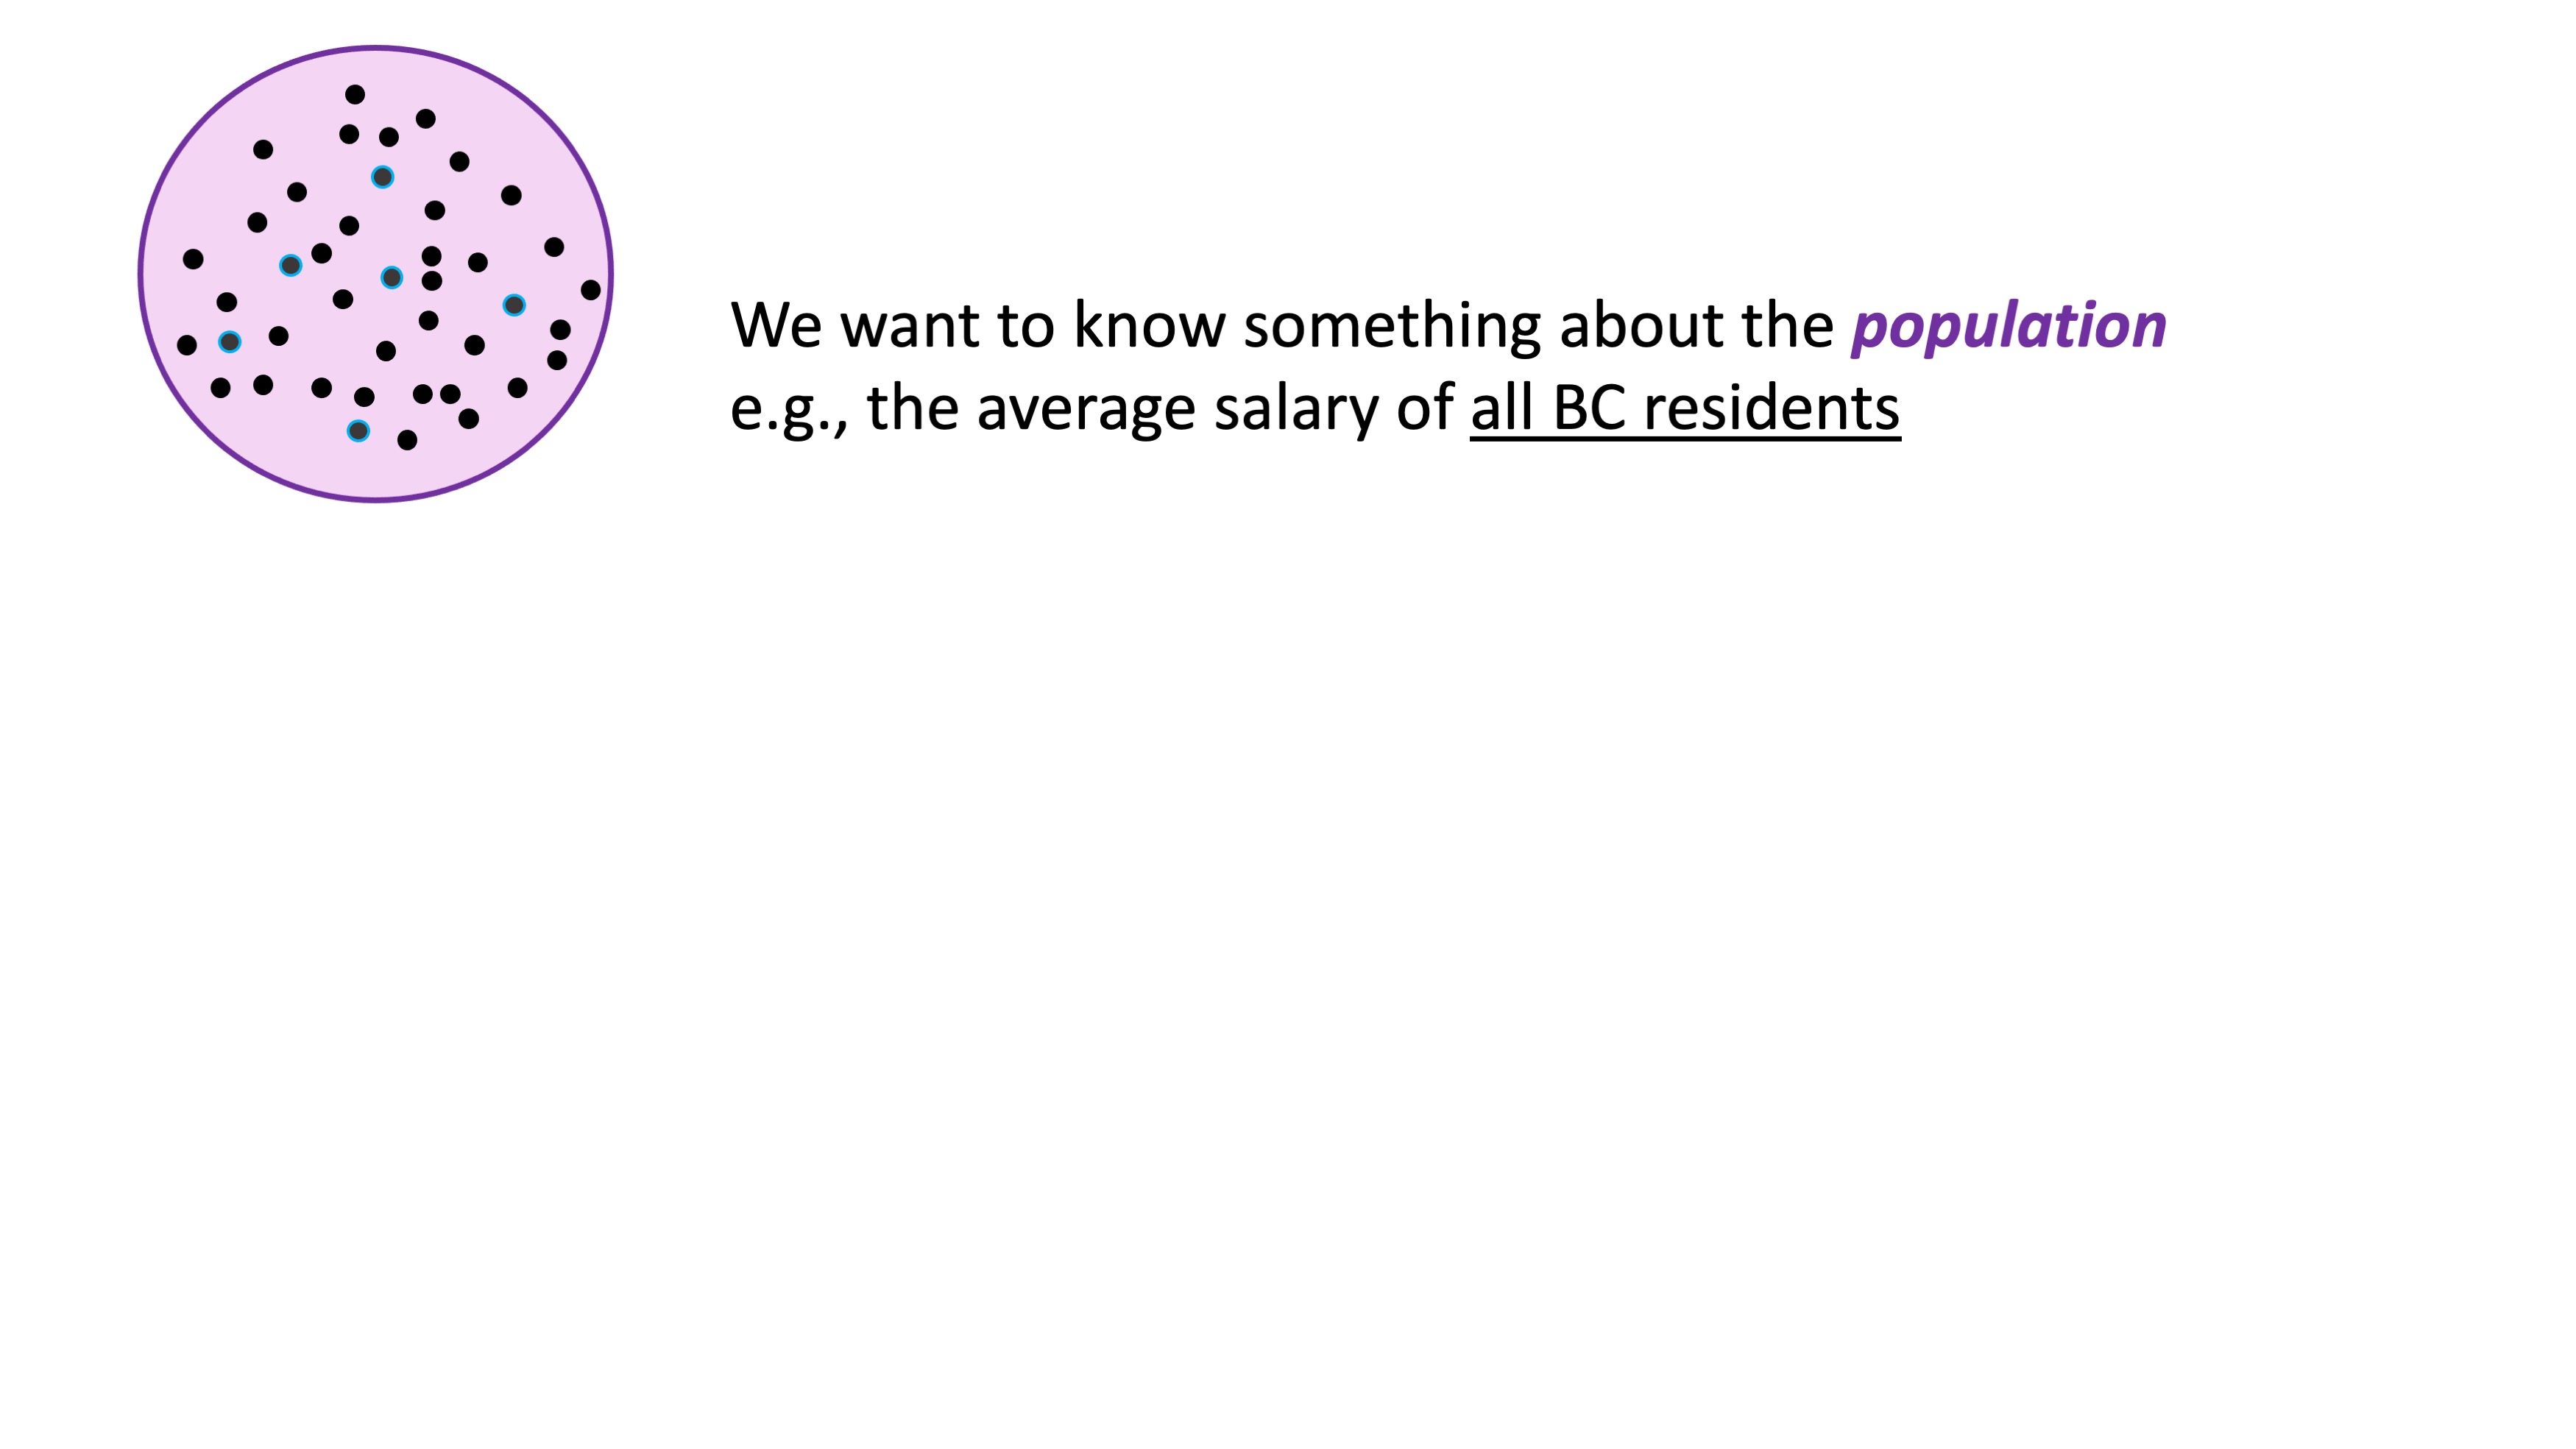
Review: Parameter Estimation
Review: Parameter Estimation
Review: Parameter Estimation
Review: Parameter Estimation
Review: Parameter Estimation
Review: Sampling Distribution
Review: Sampling Distribution
Review: Sampling Distribution
Review: Sampling Distribution
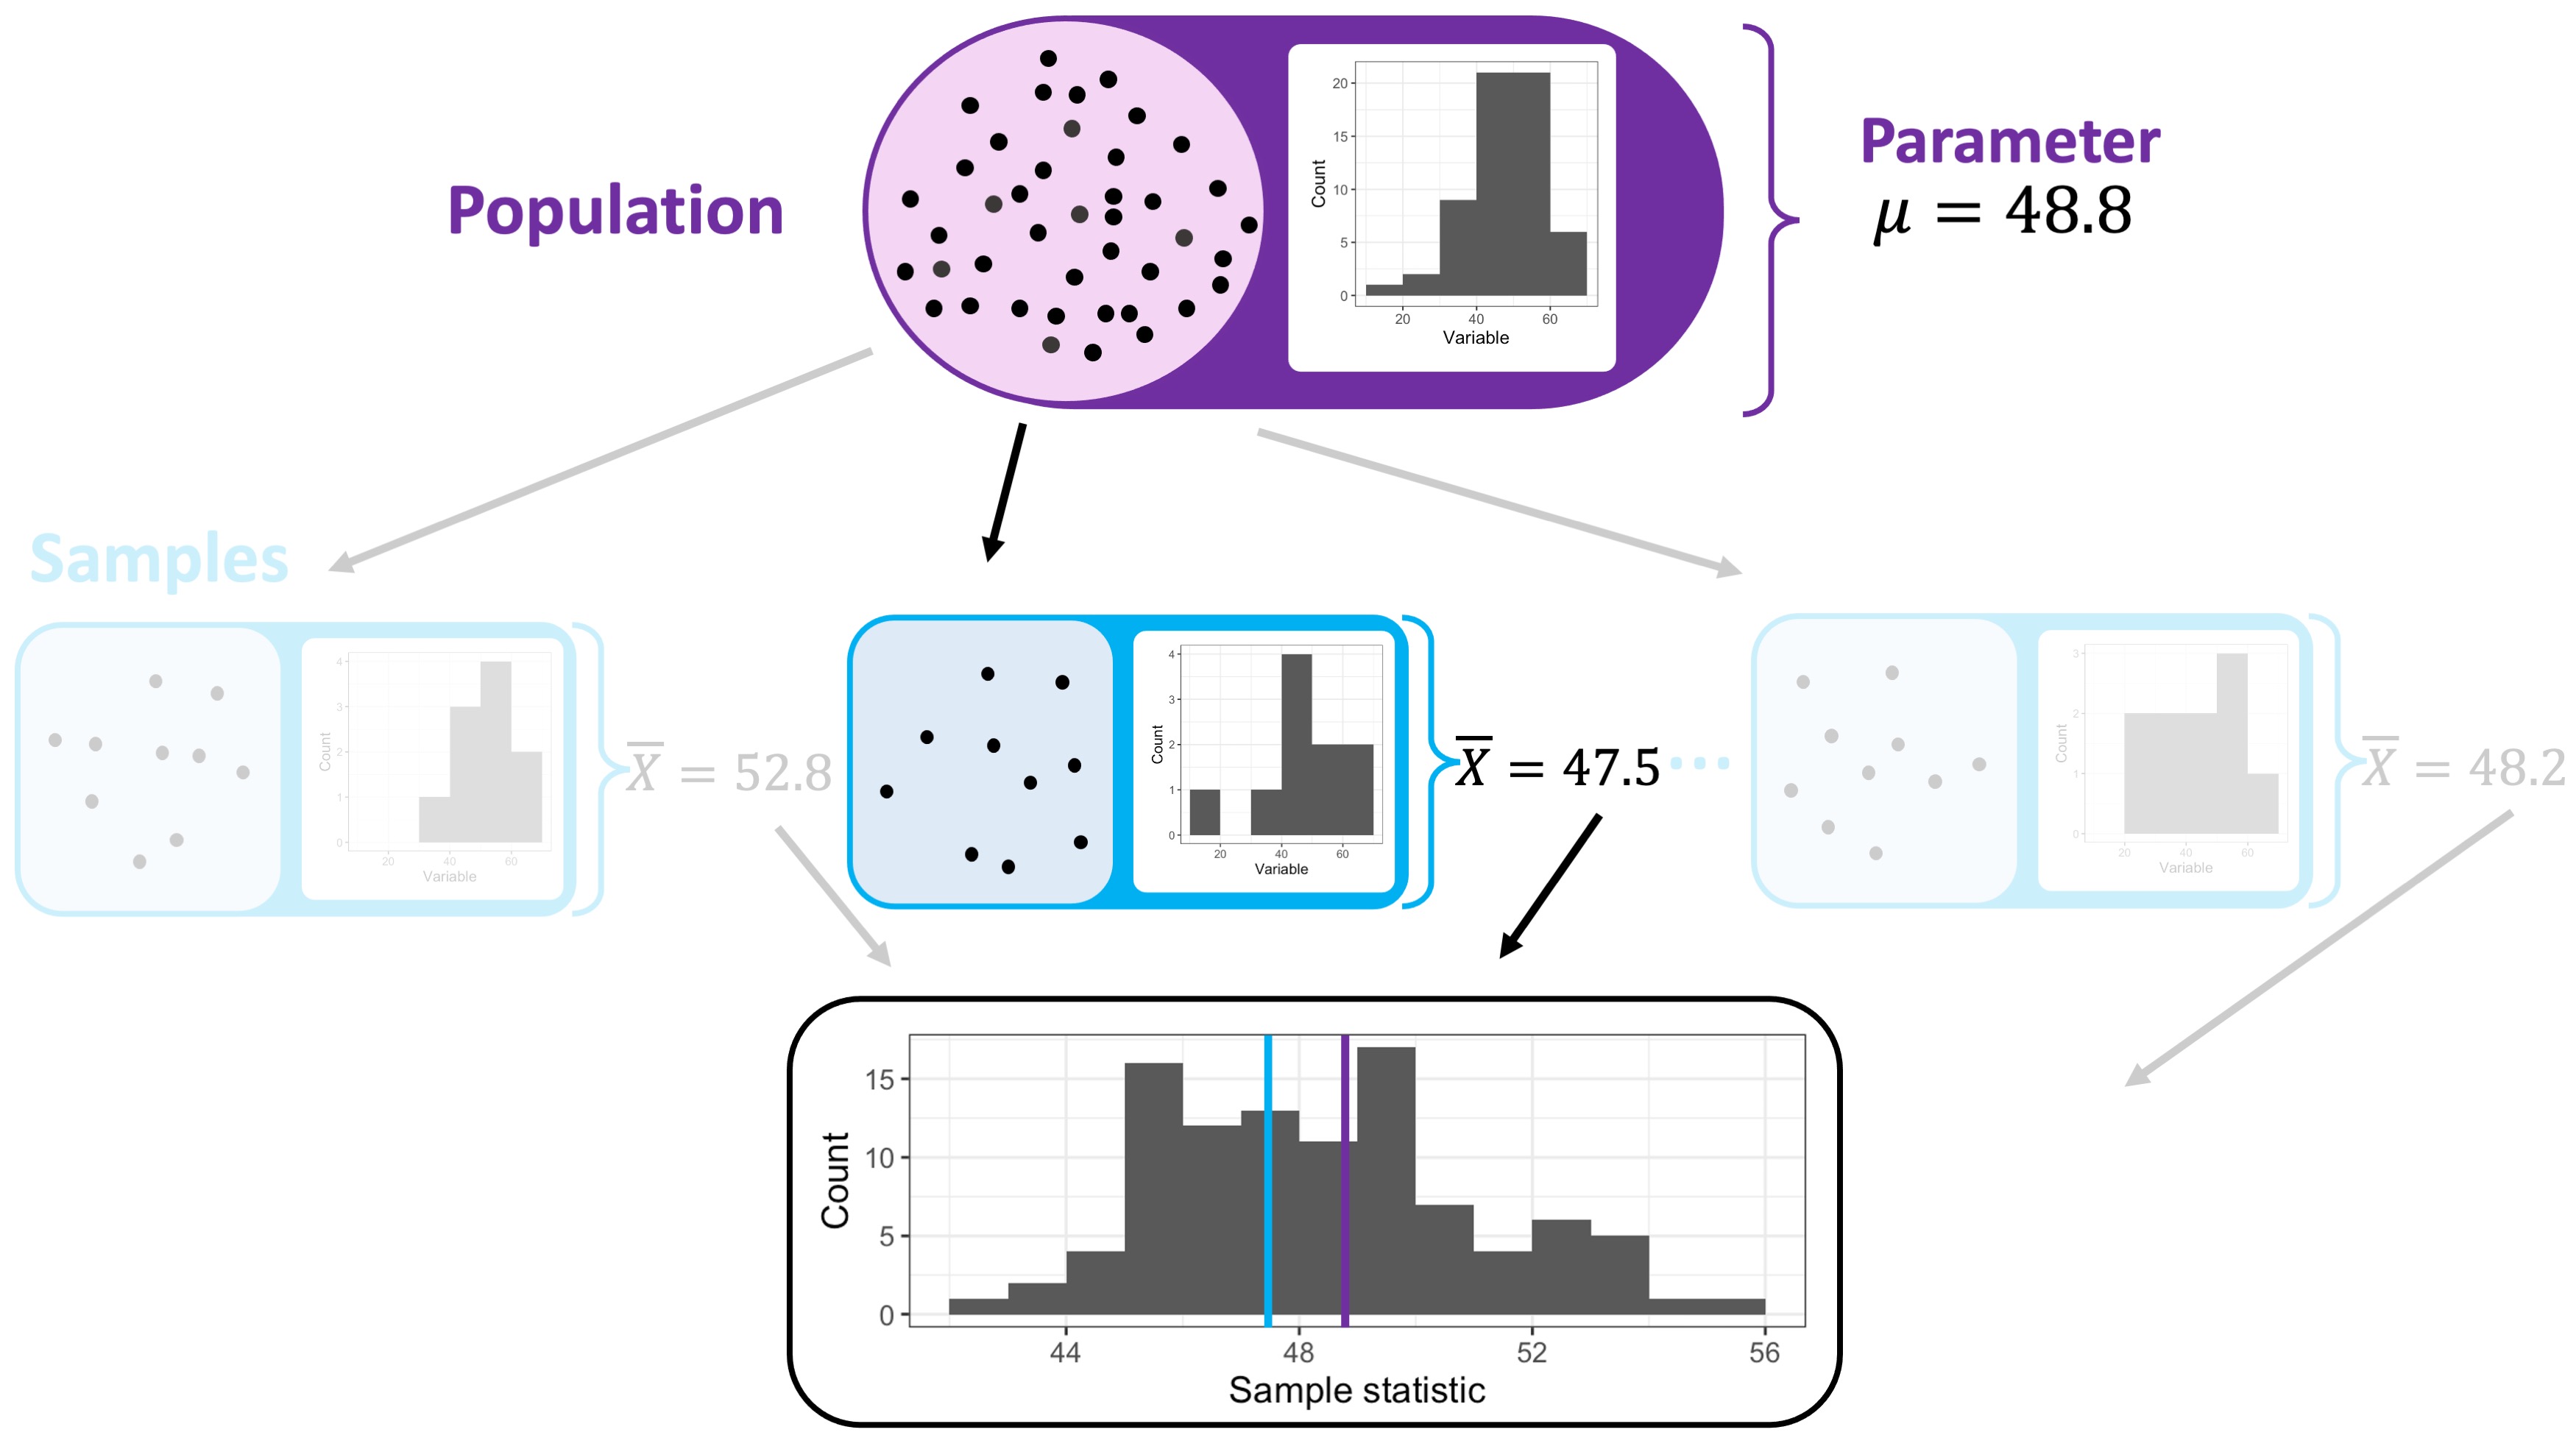
Review: Sampling Distribution
Important
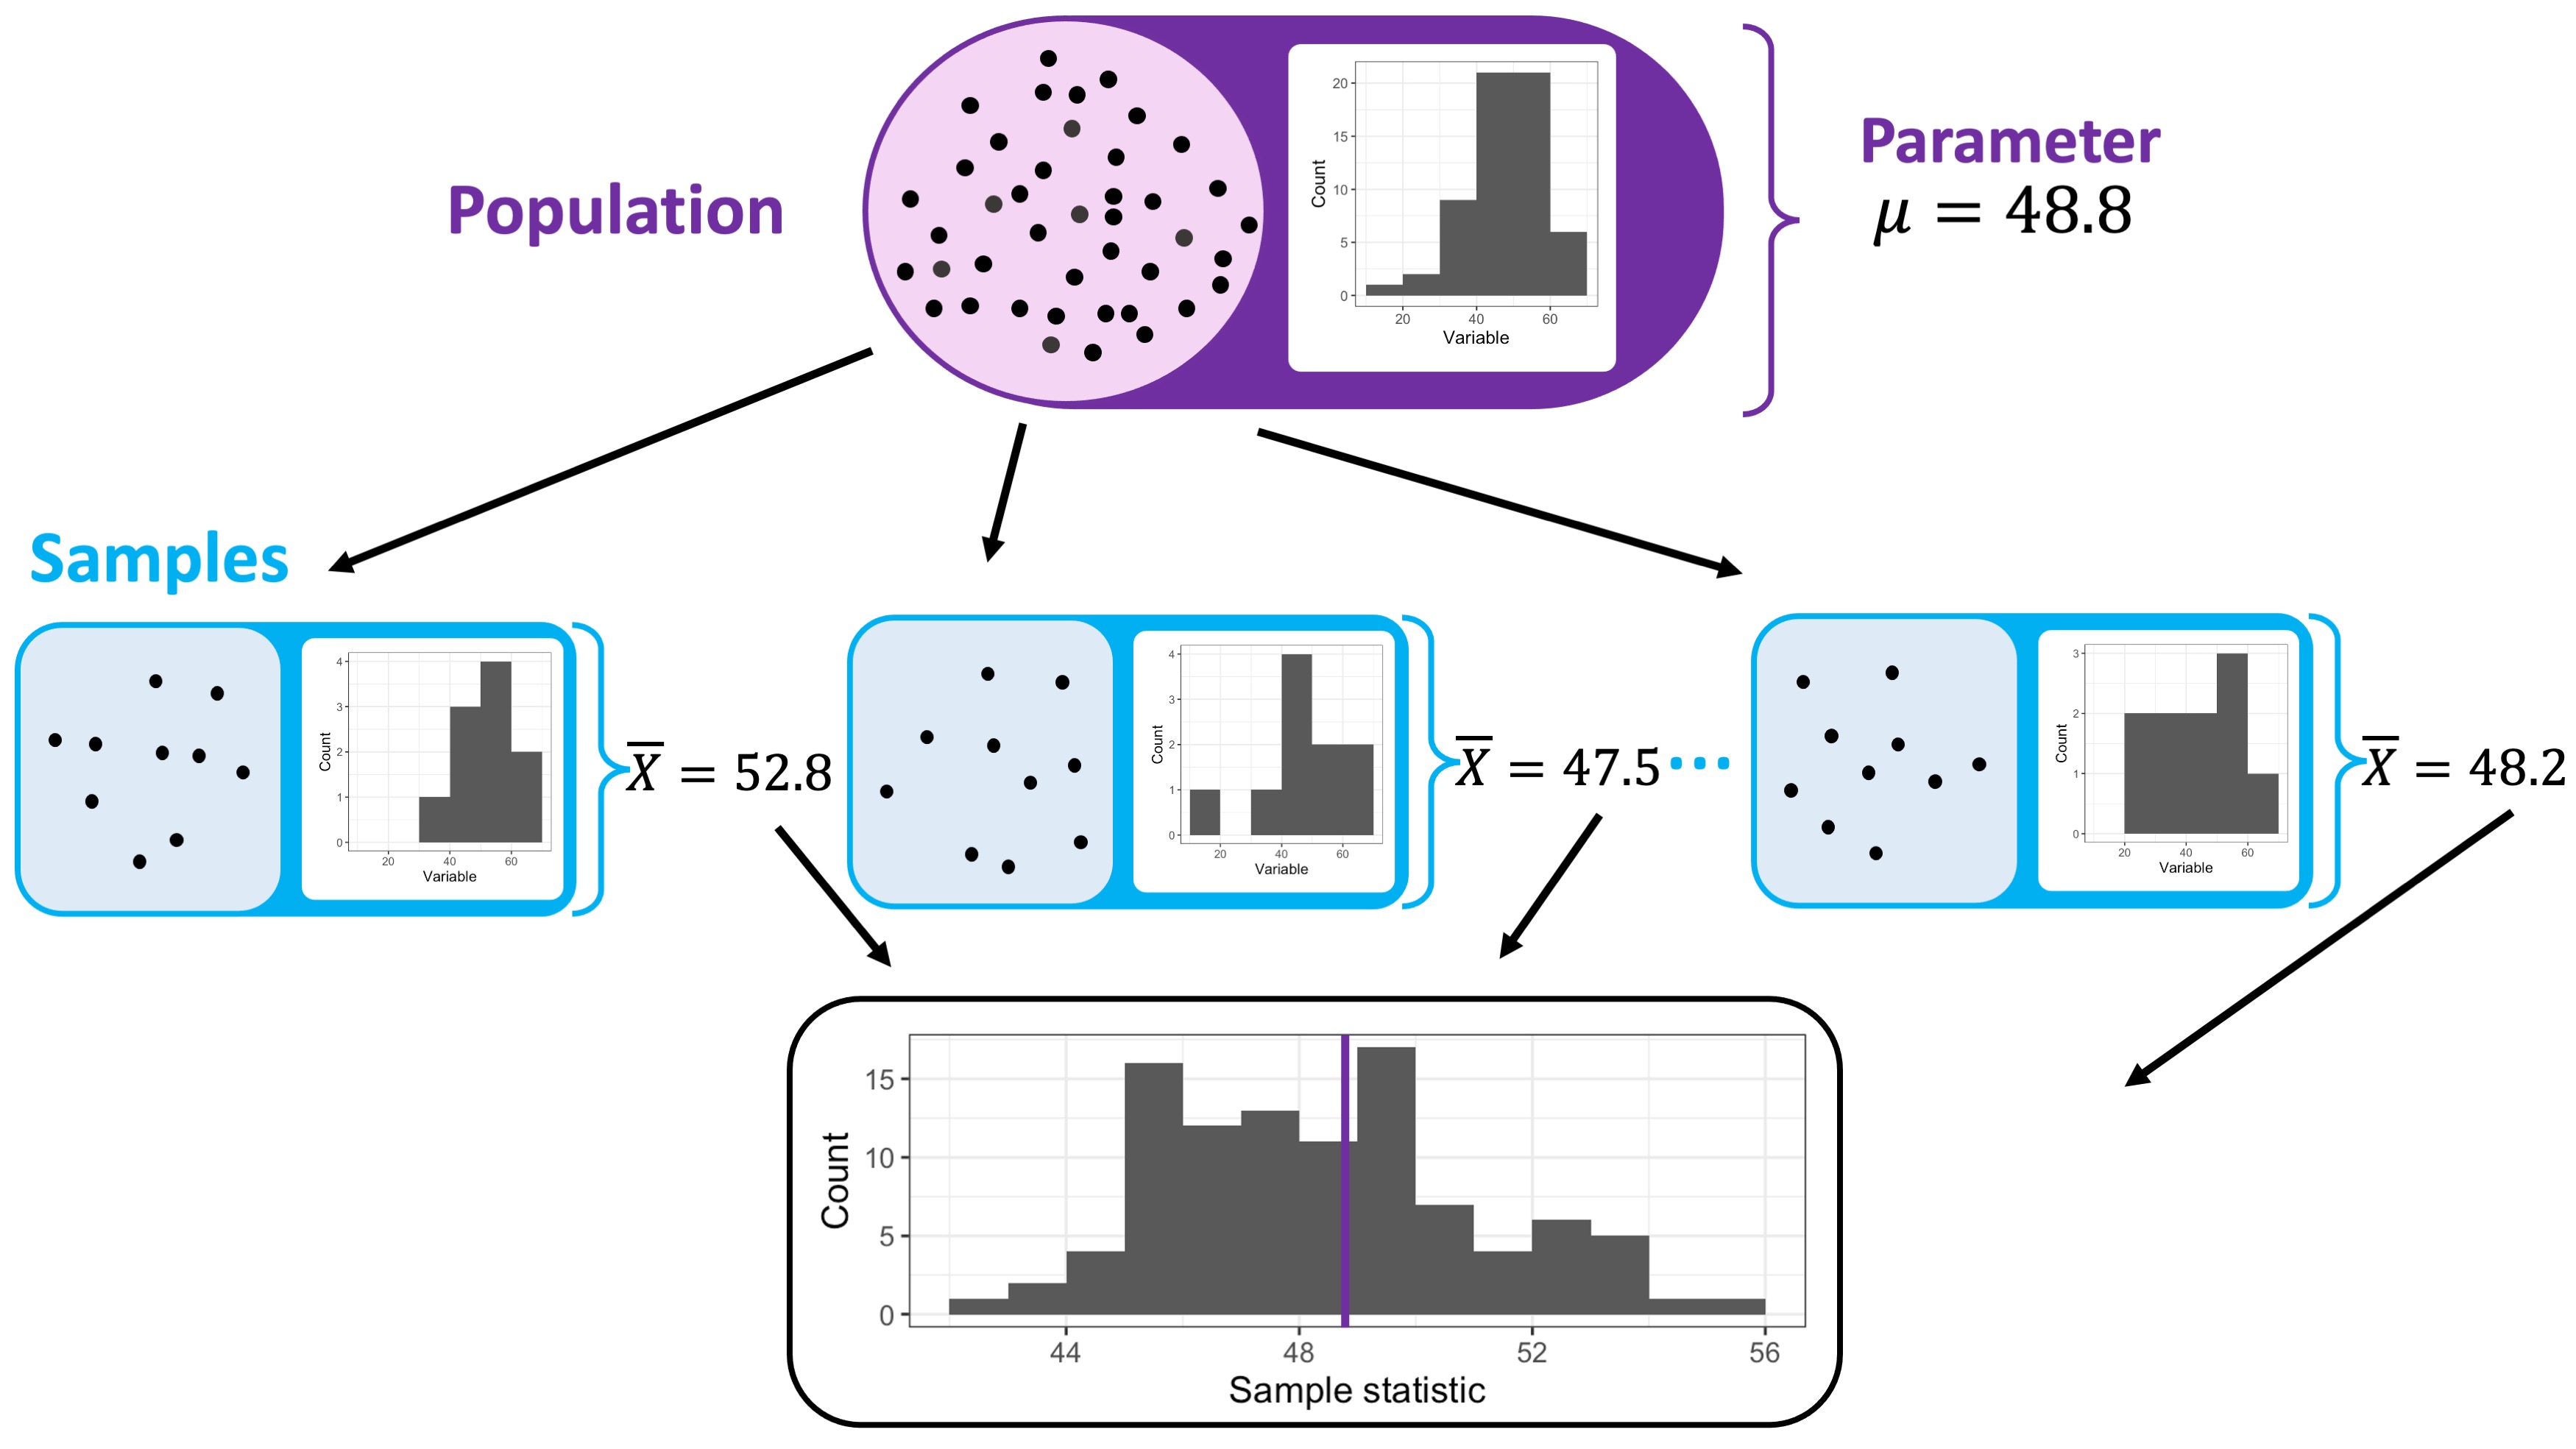
The true sampling distribution (that is unknown) shows us:
What point estimates are possible (even more: their probabilities of occurring)
Where the true parameter is (e.g. for means it lies at the mean of the sampling distribution)
Quantifying the uncertainty with the standard error
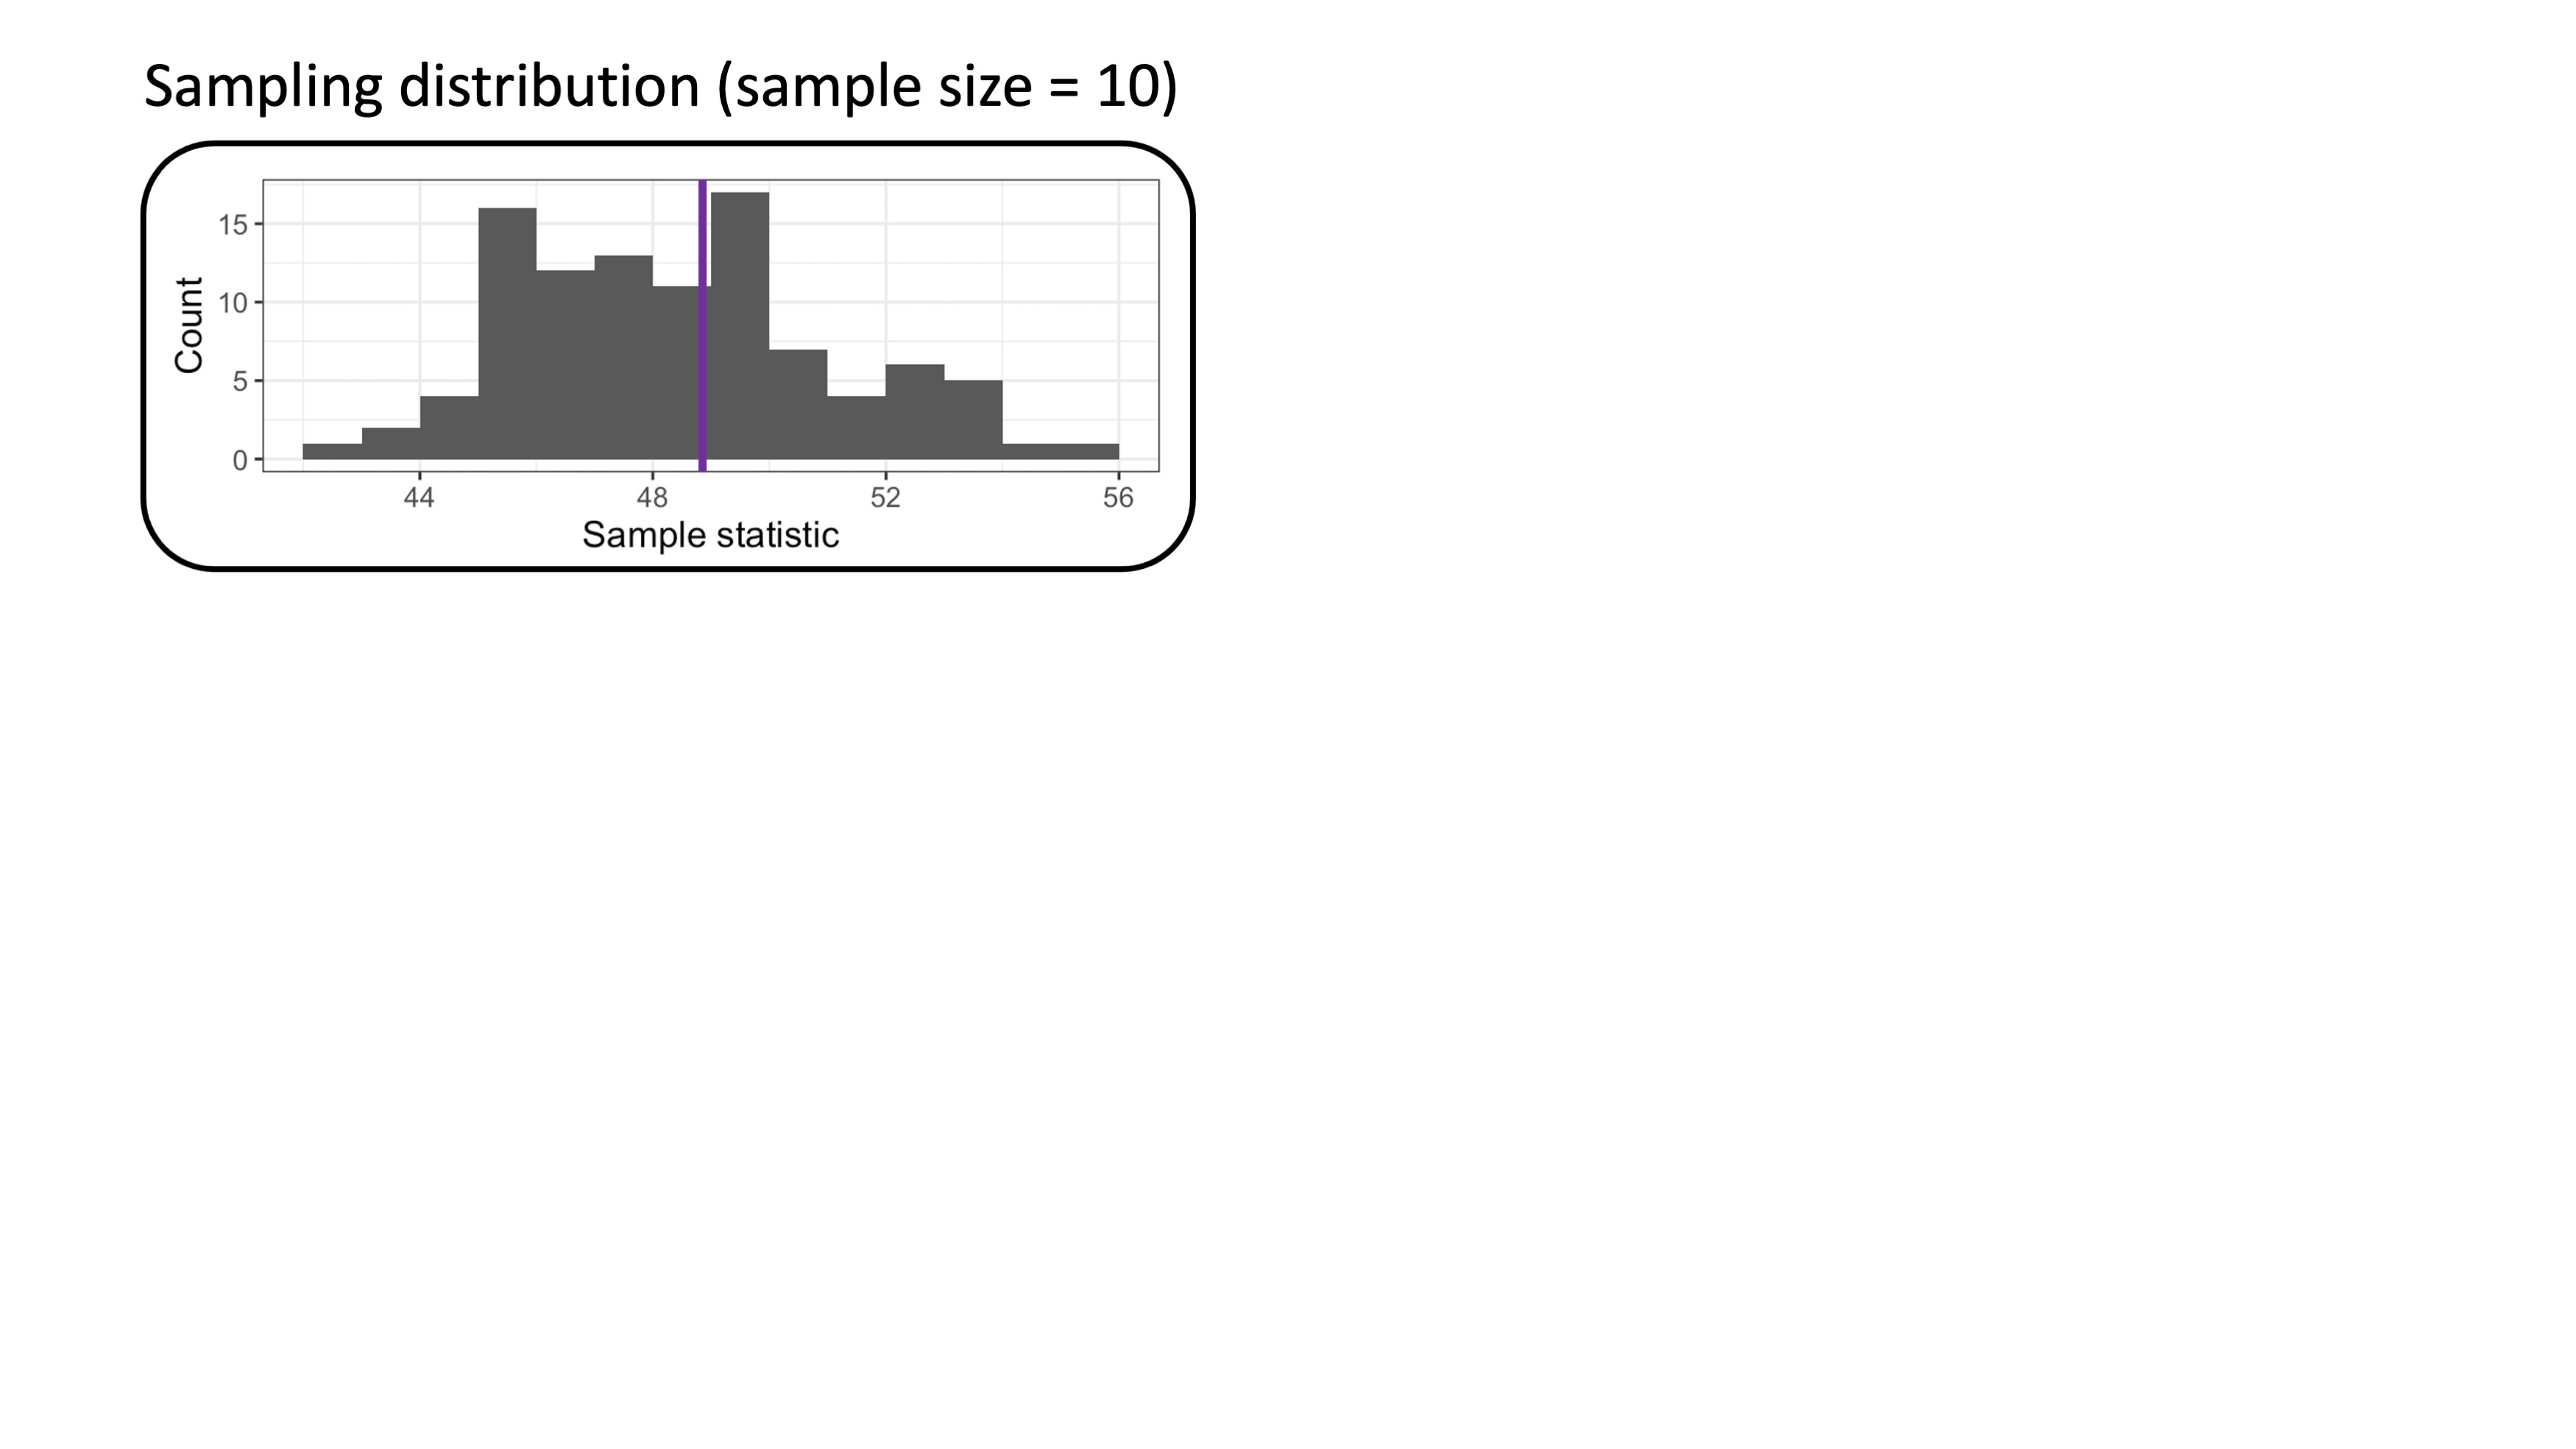
Quantifying the uncertainty with the standard error
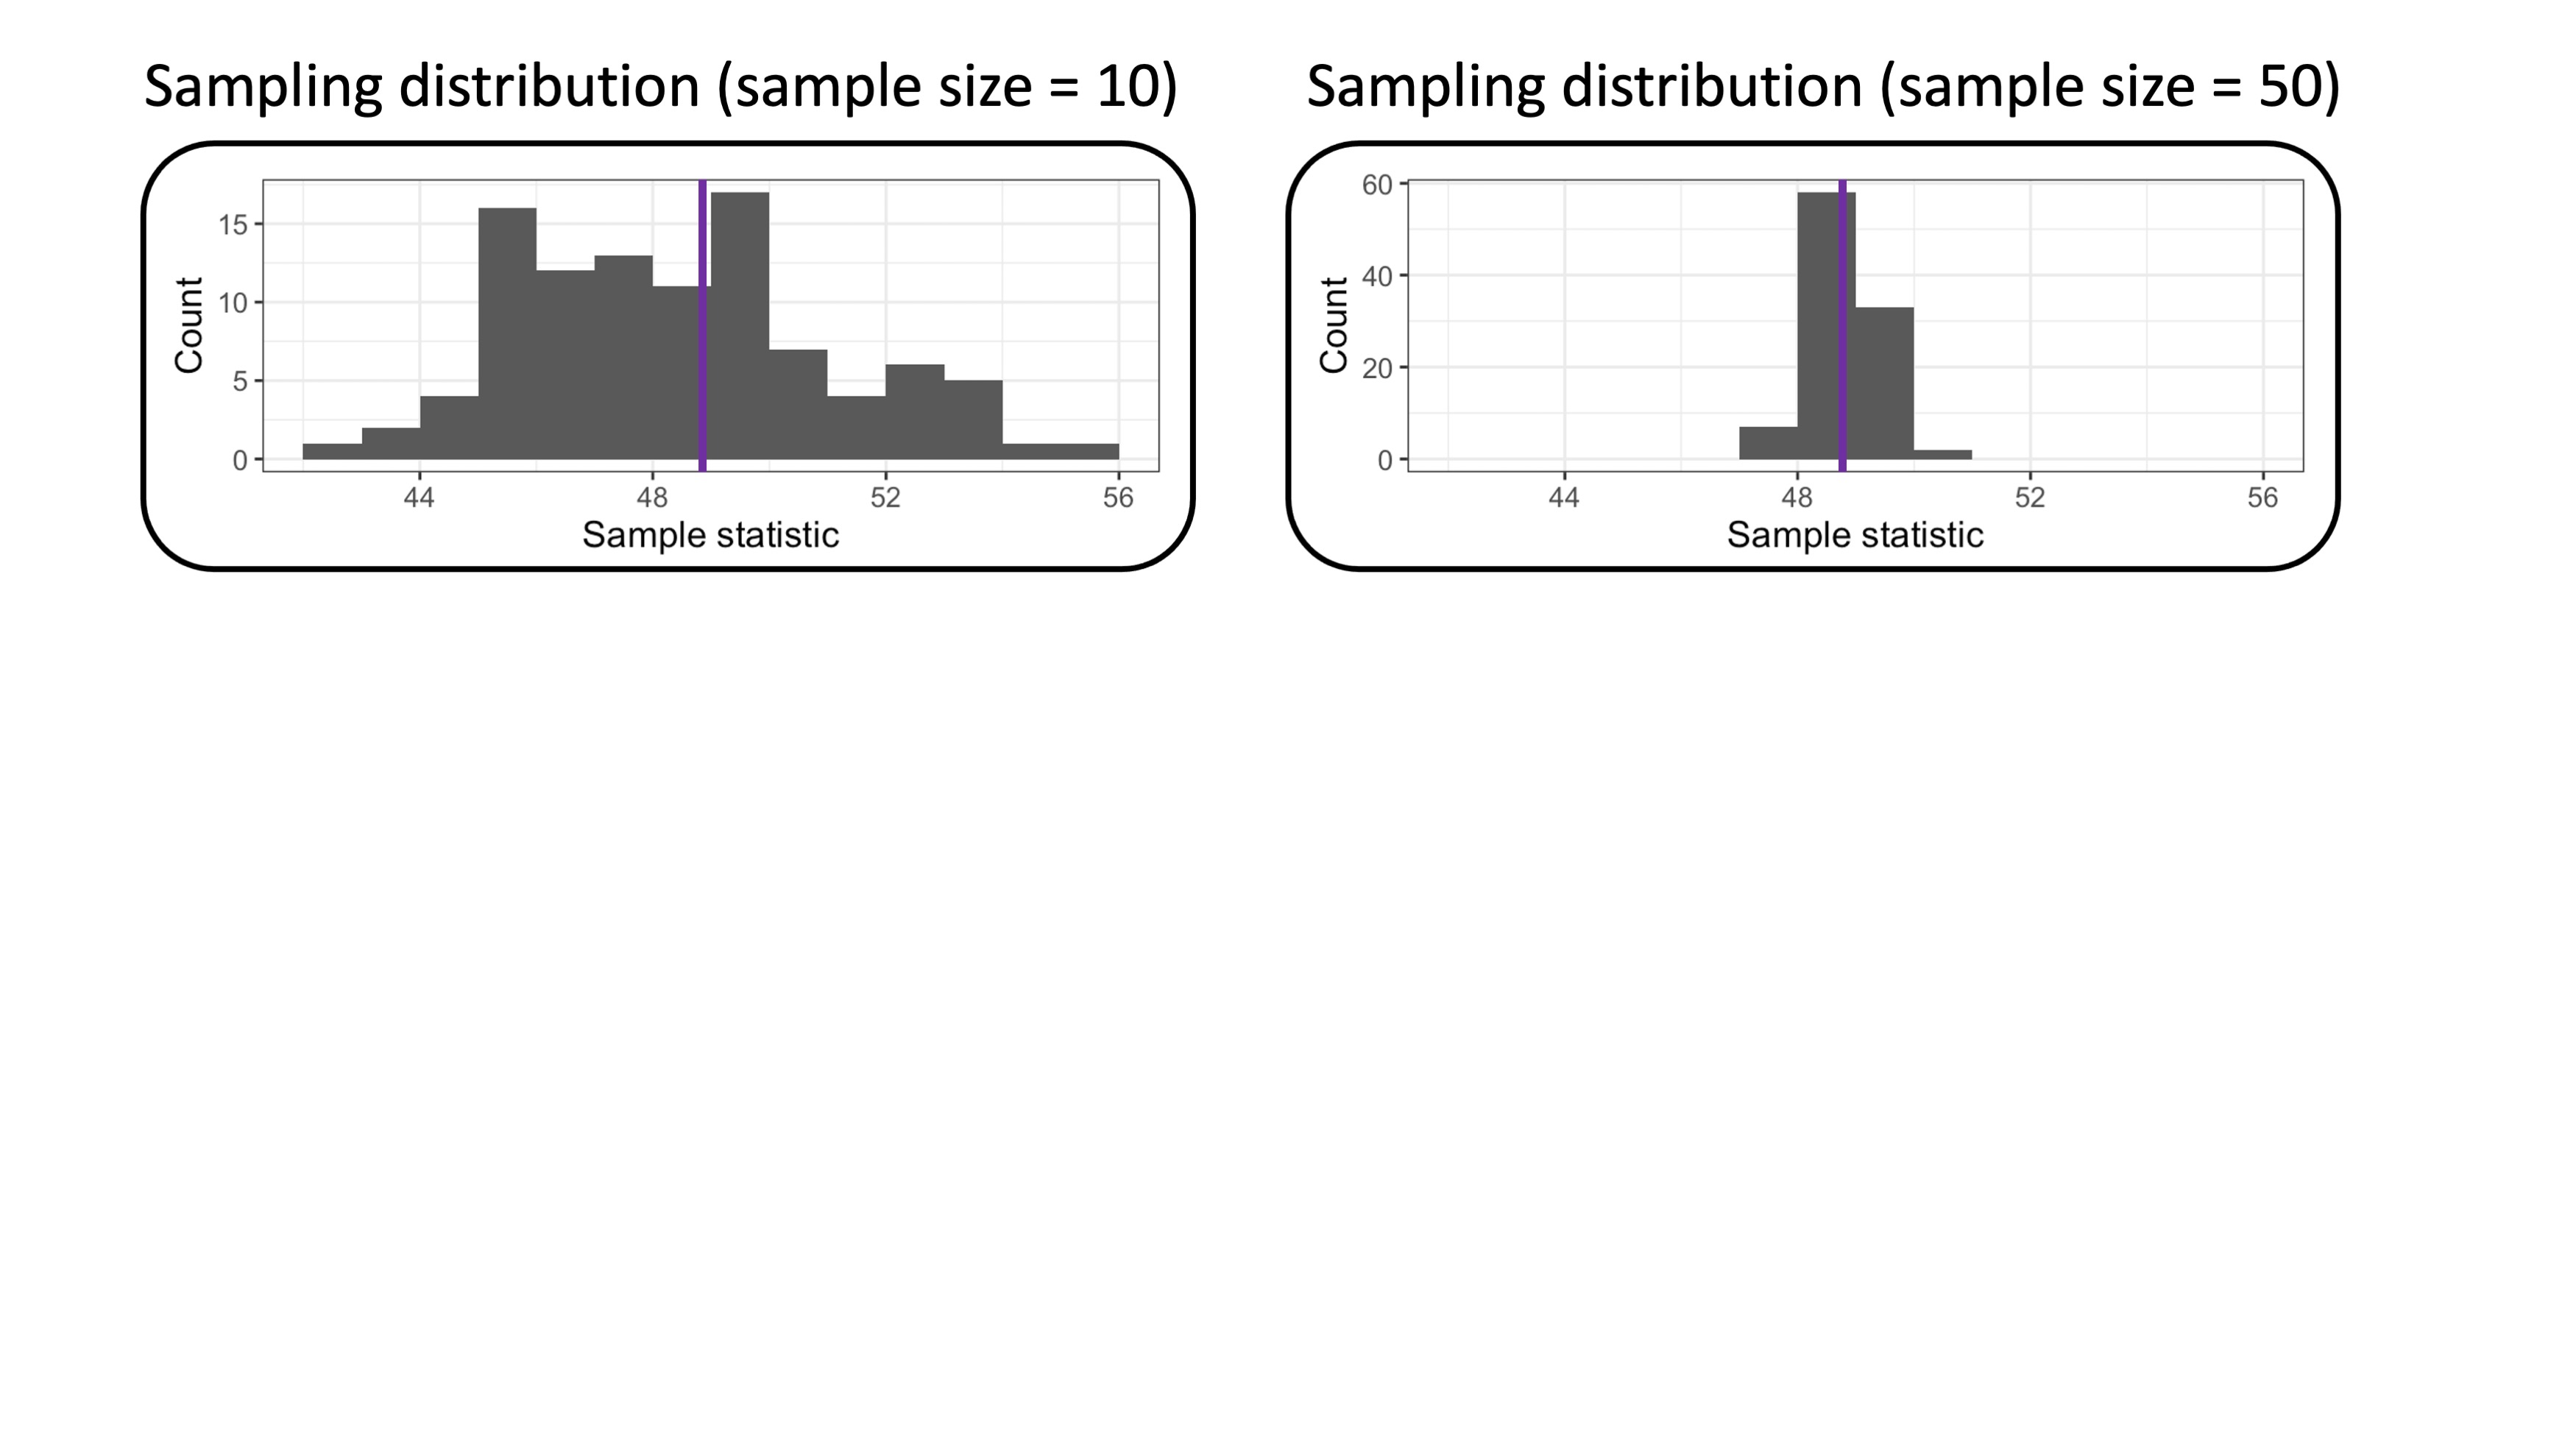
Quantifying the uncertainty with the standard error
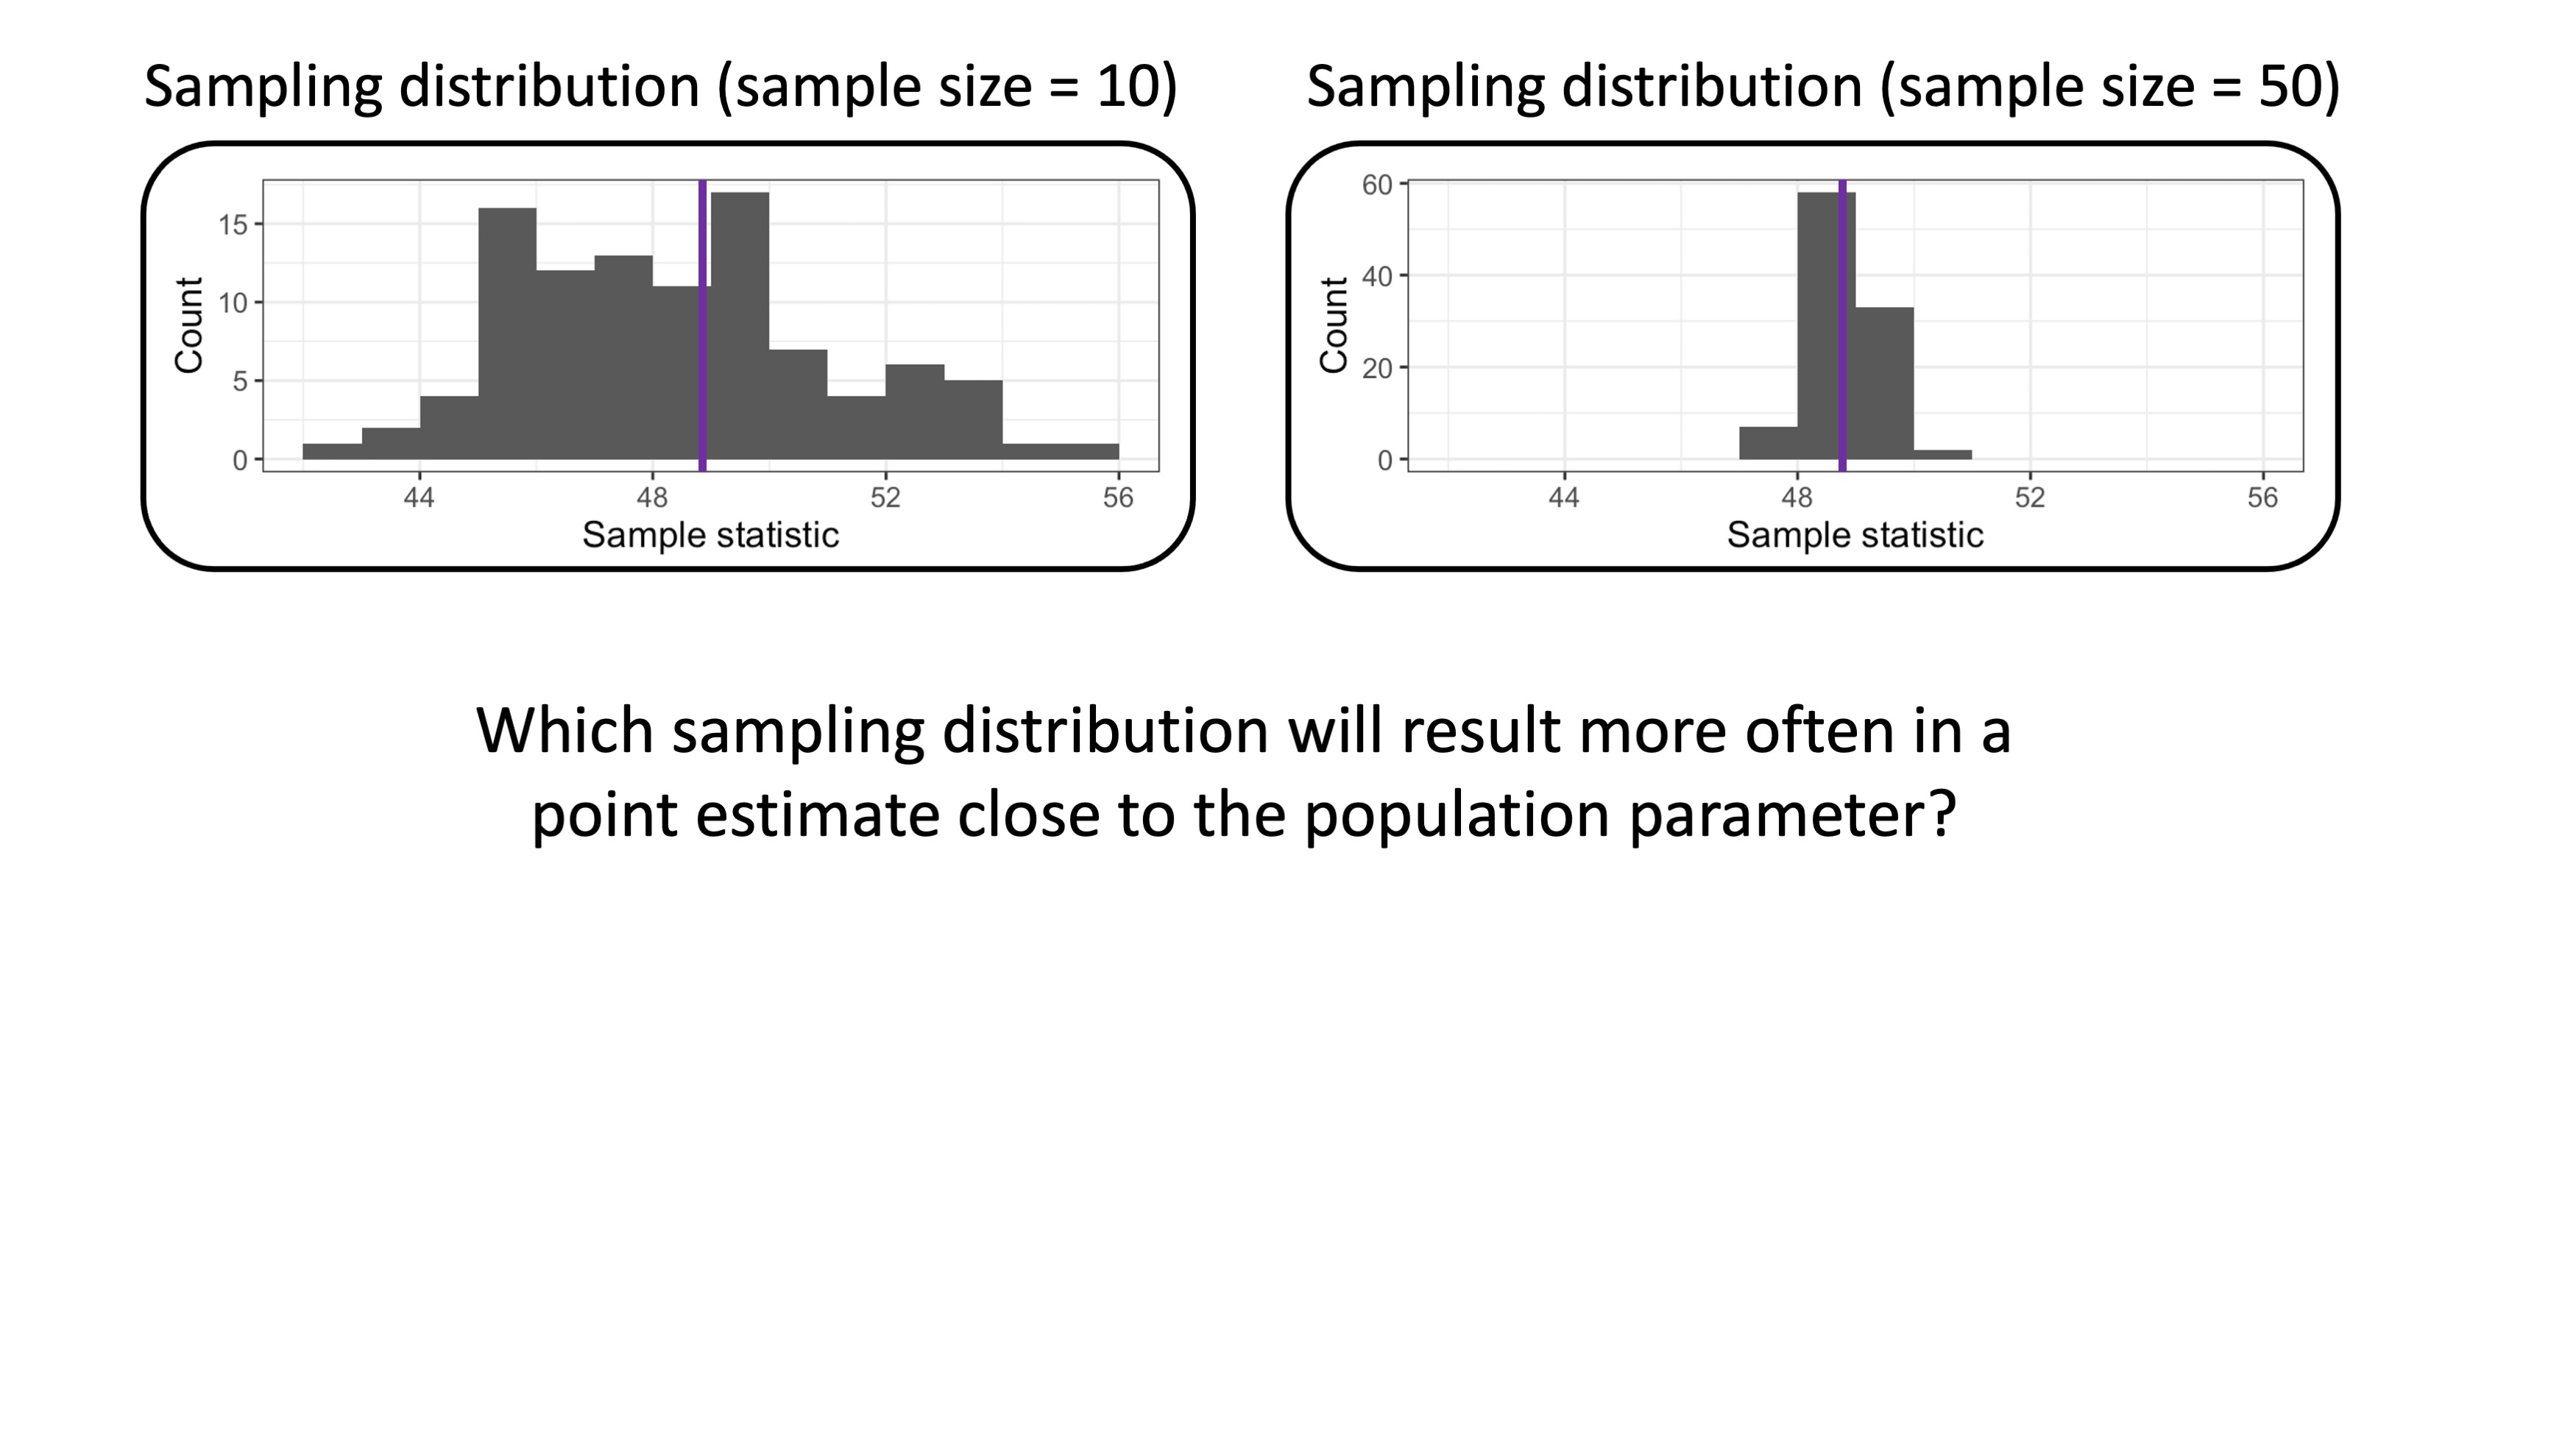
Quantifying the uncertainty with the standard error
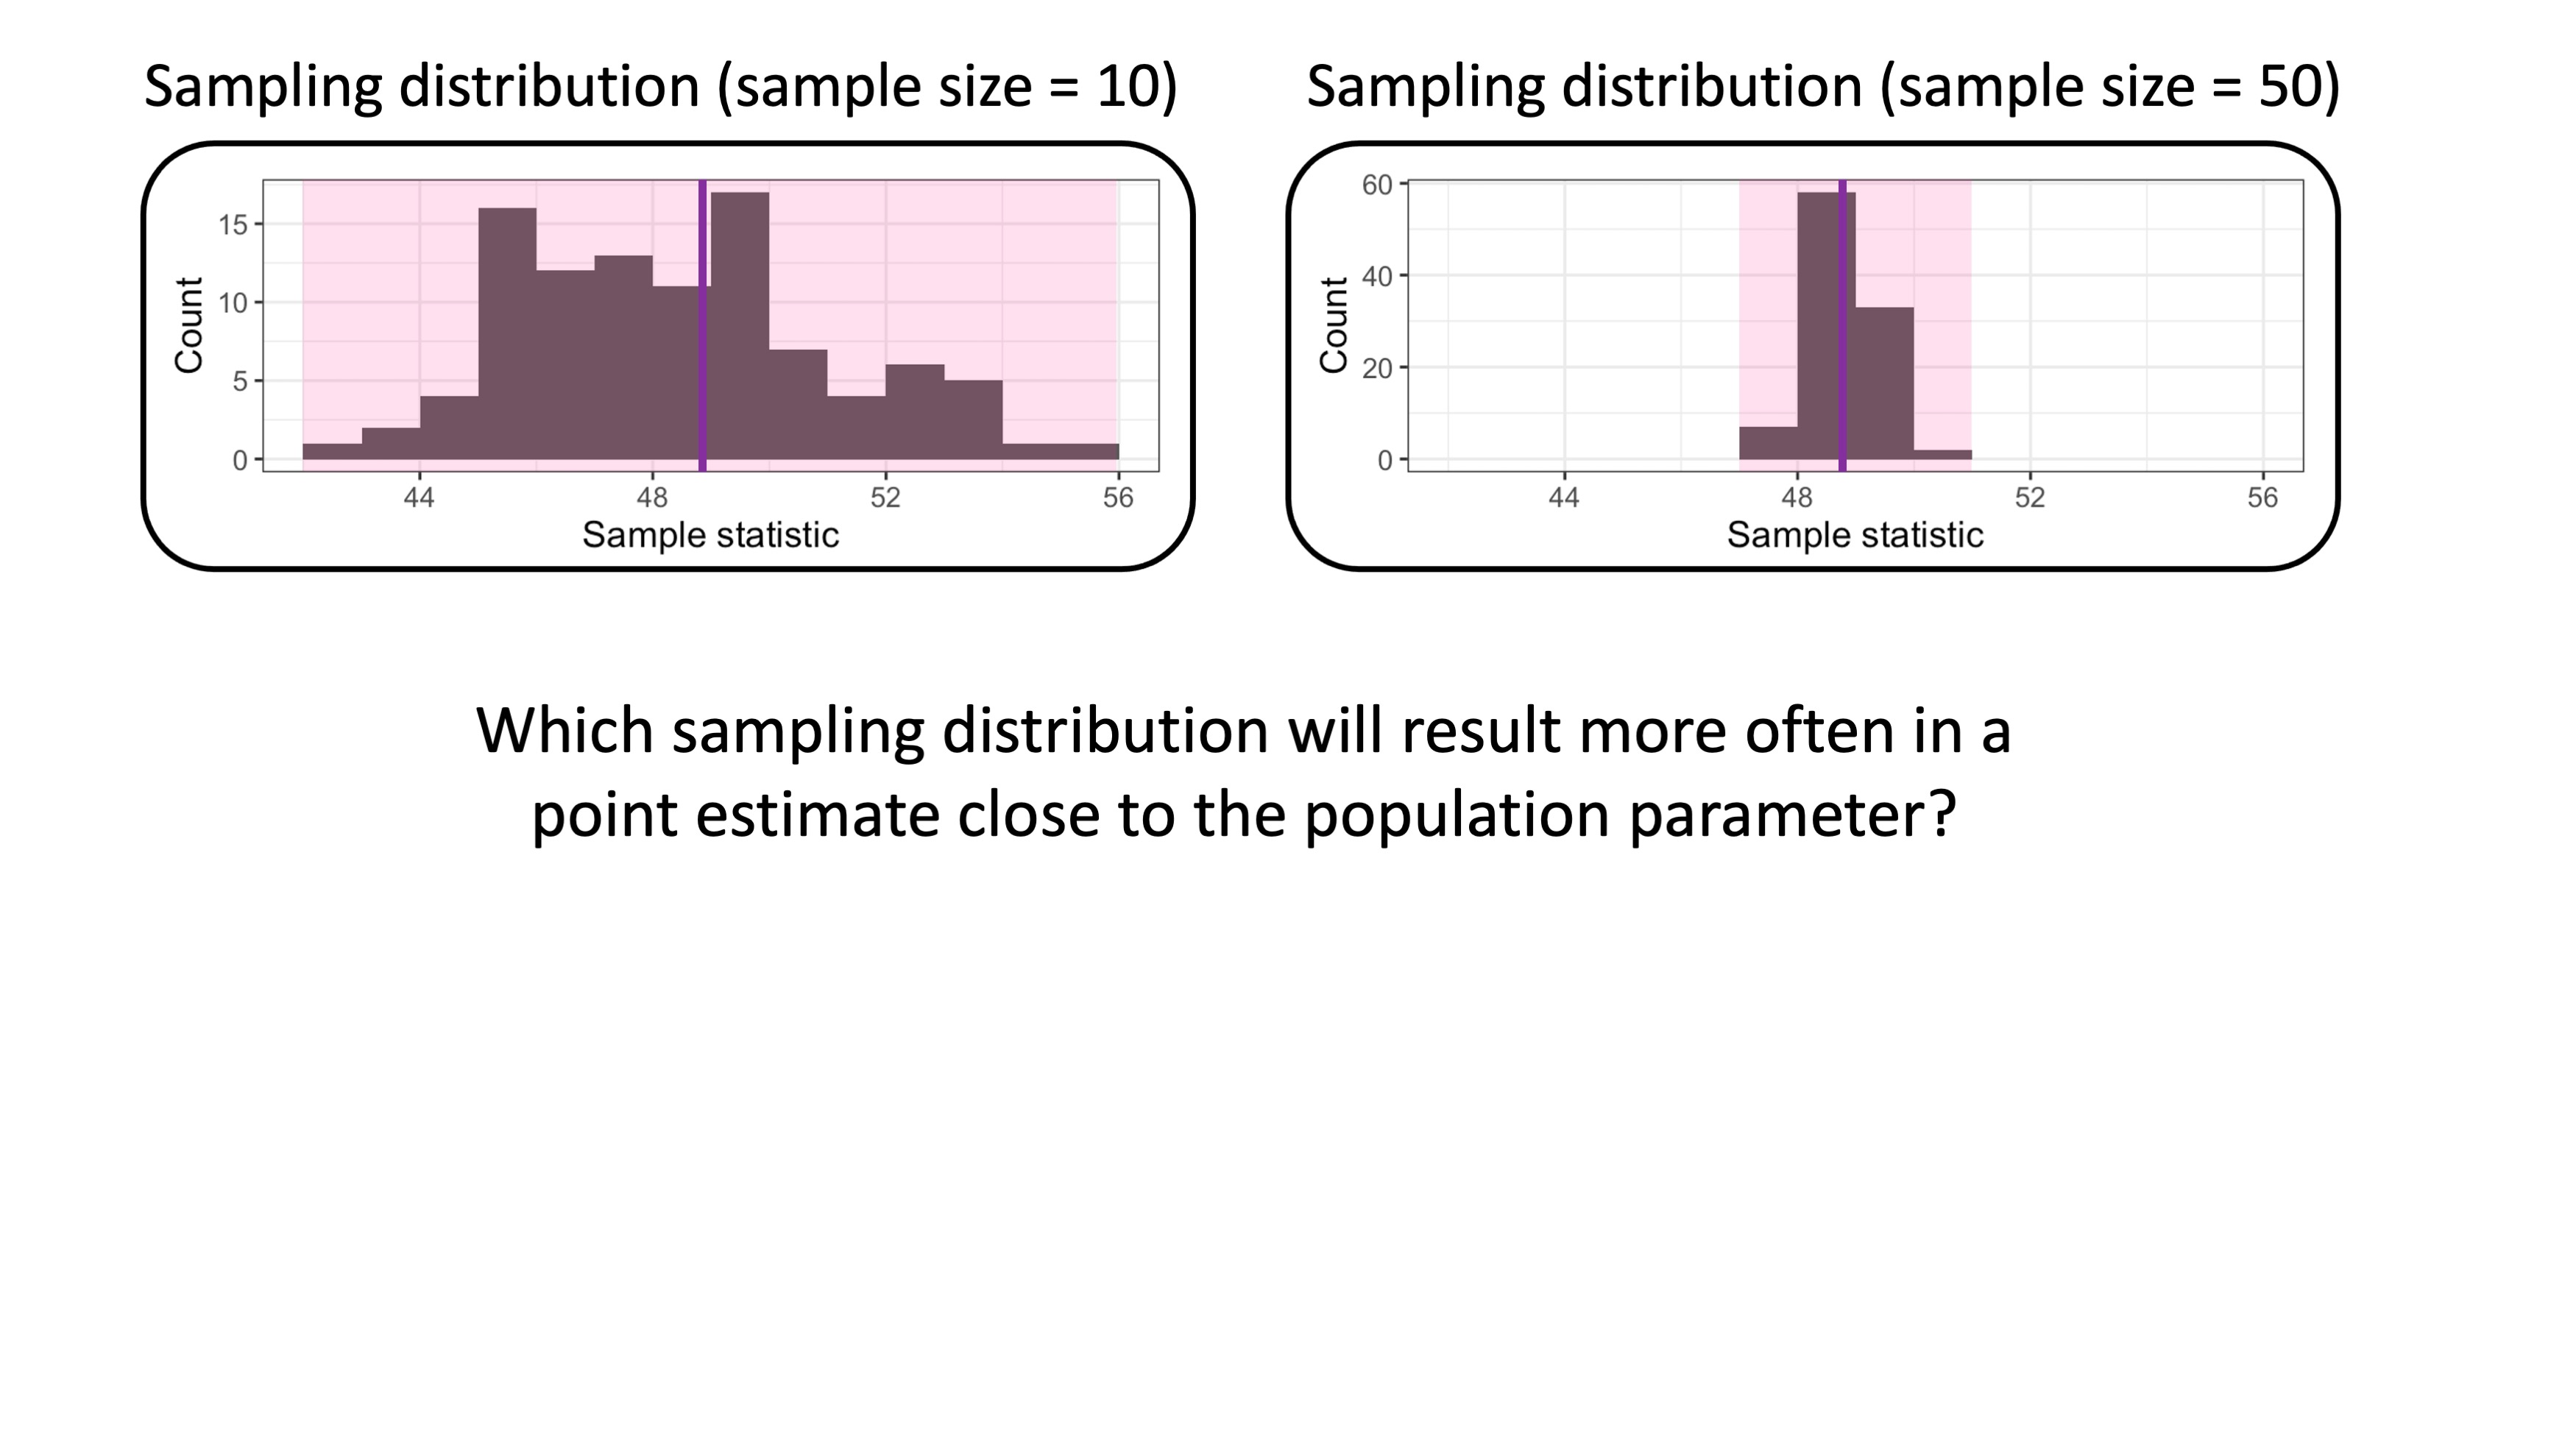
Quantifying the uncertainty with the standard error
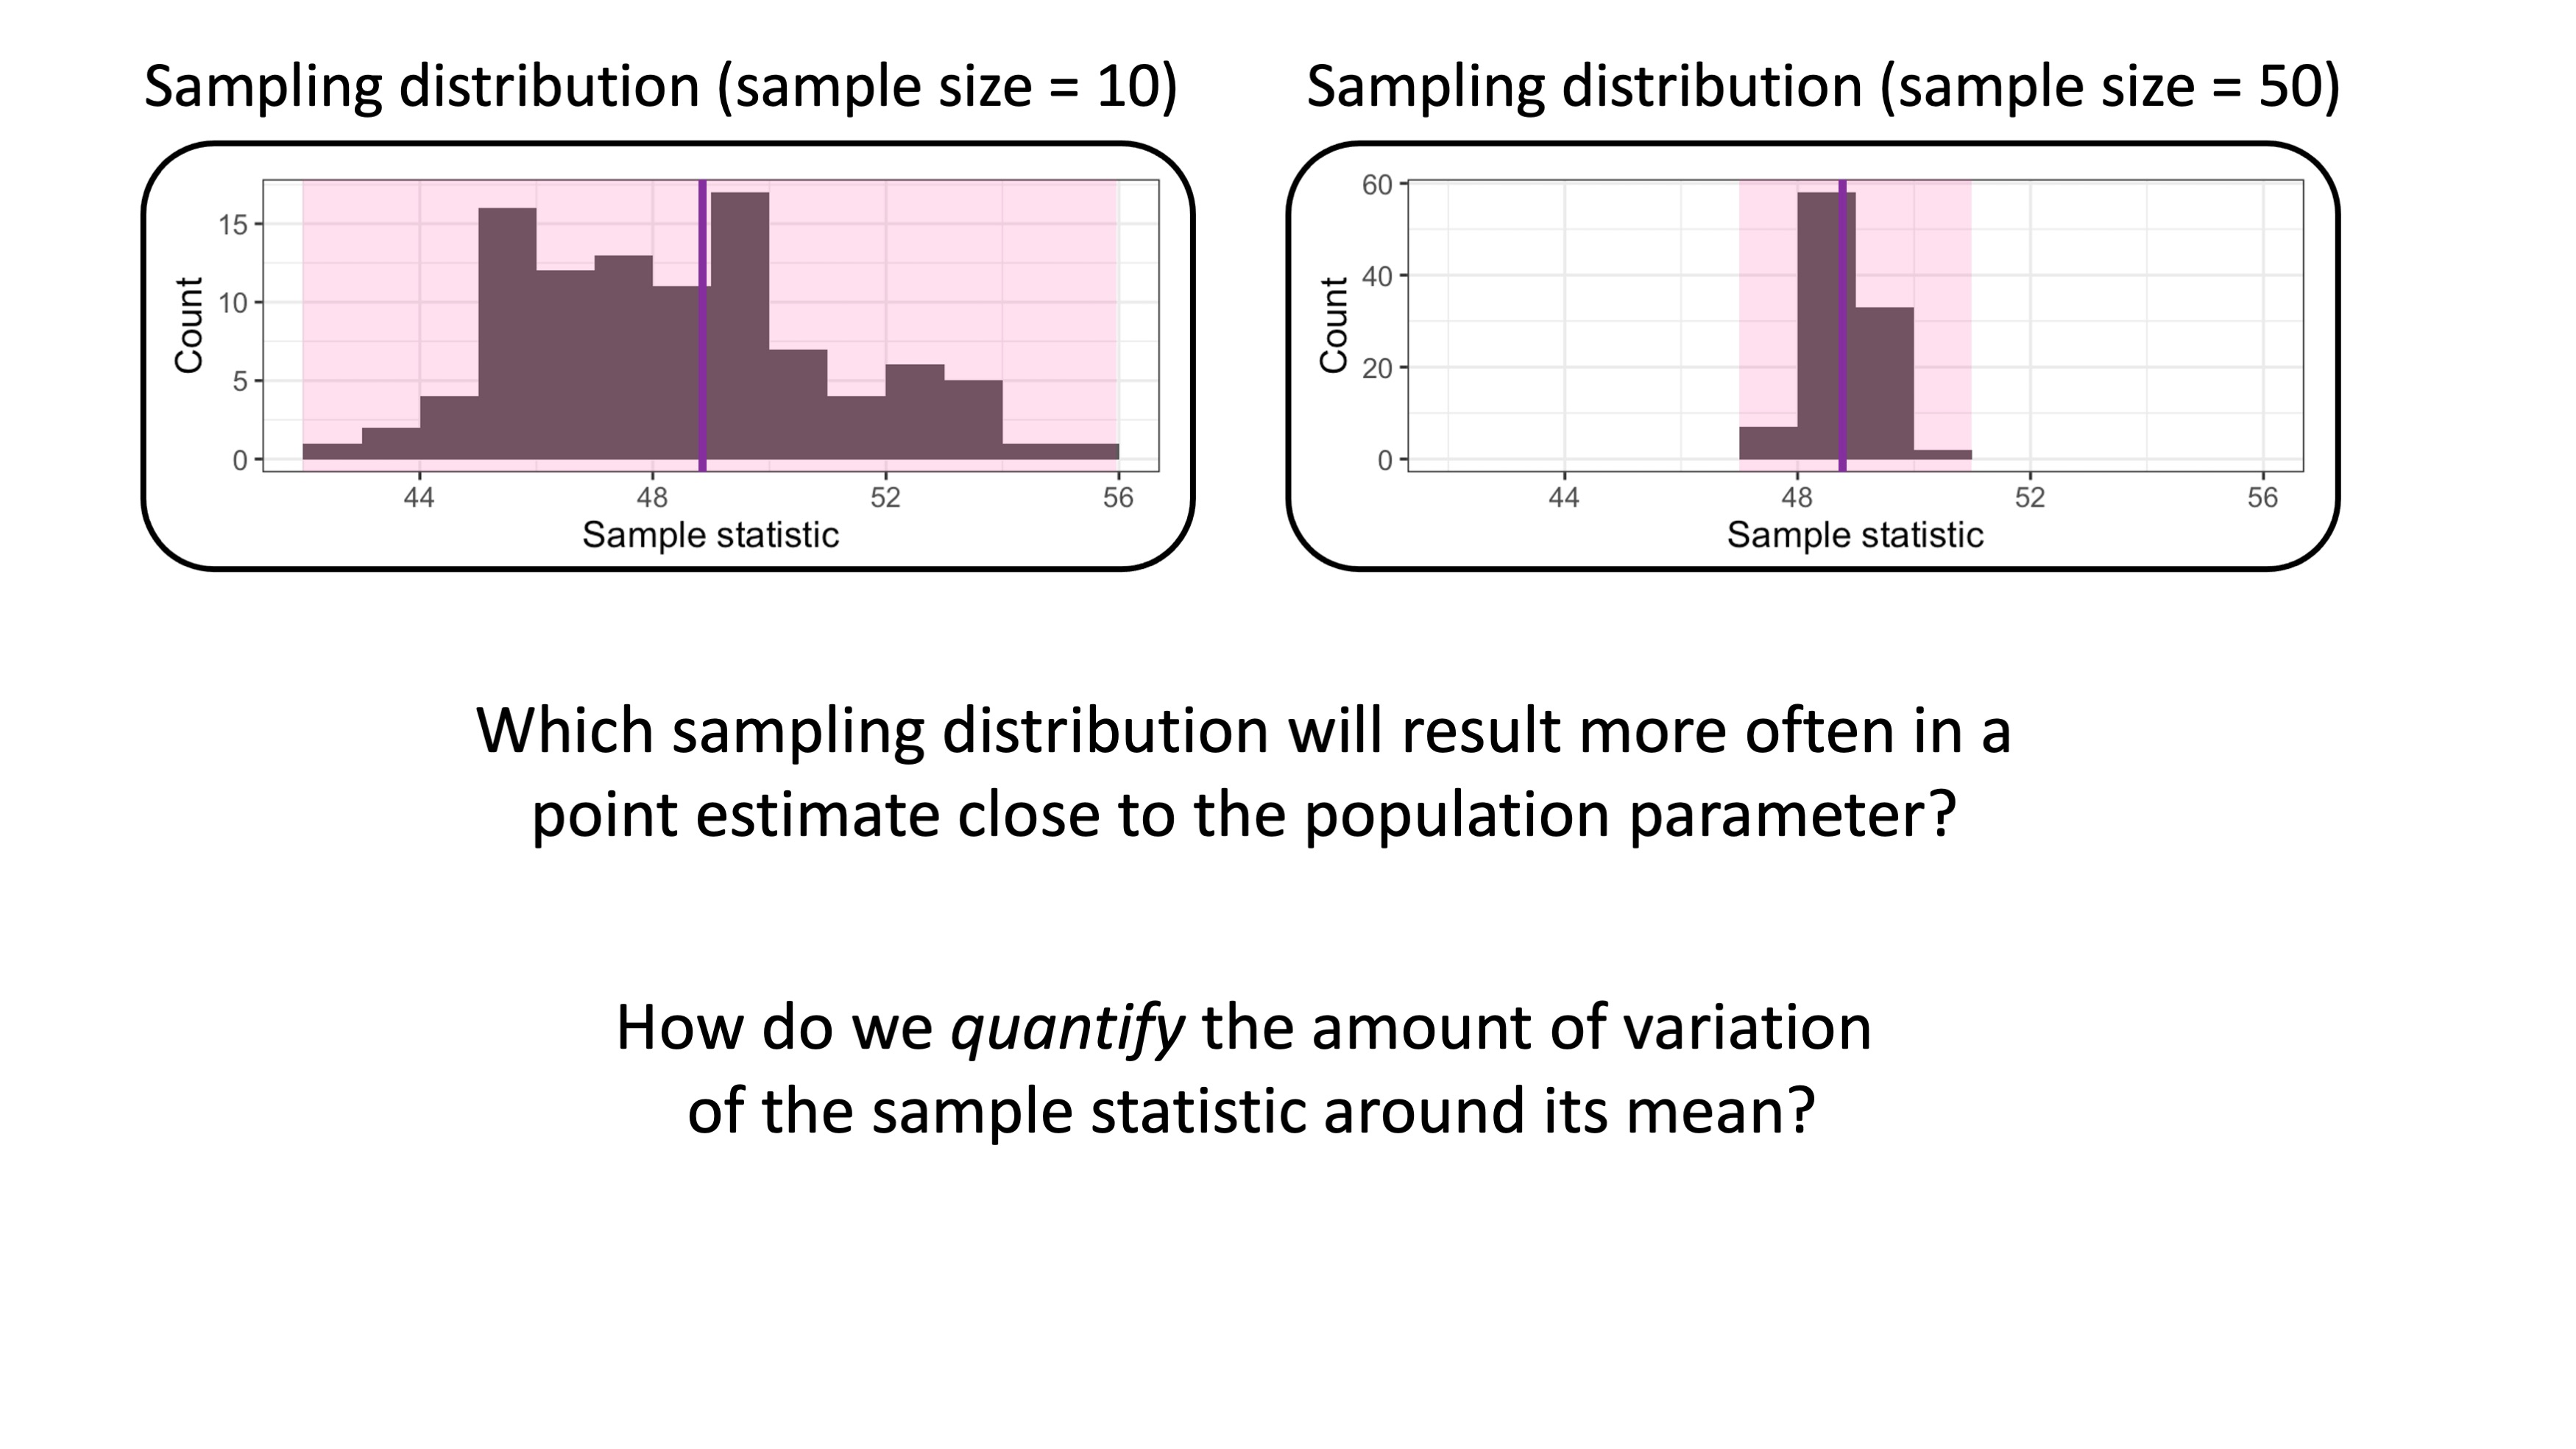
Quantifying the uncertainty with the standard error
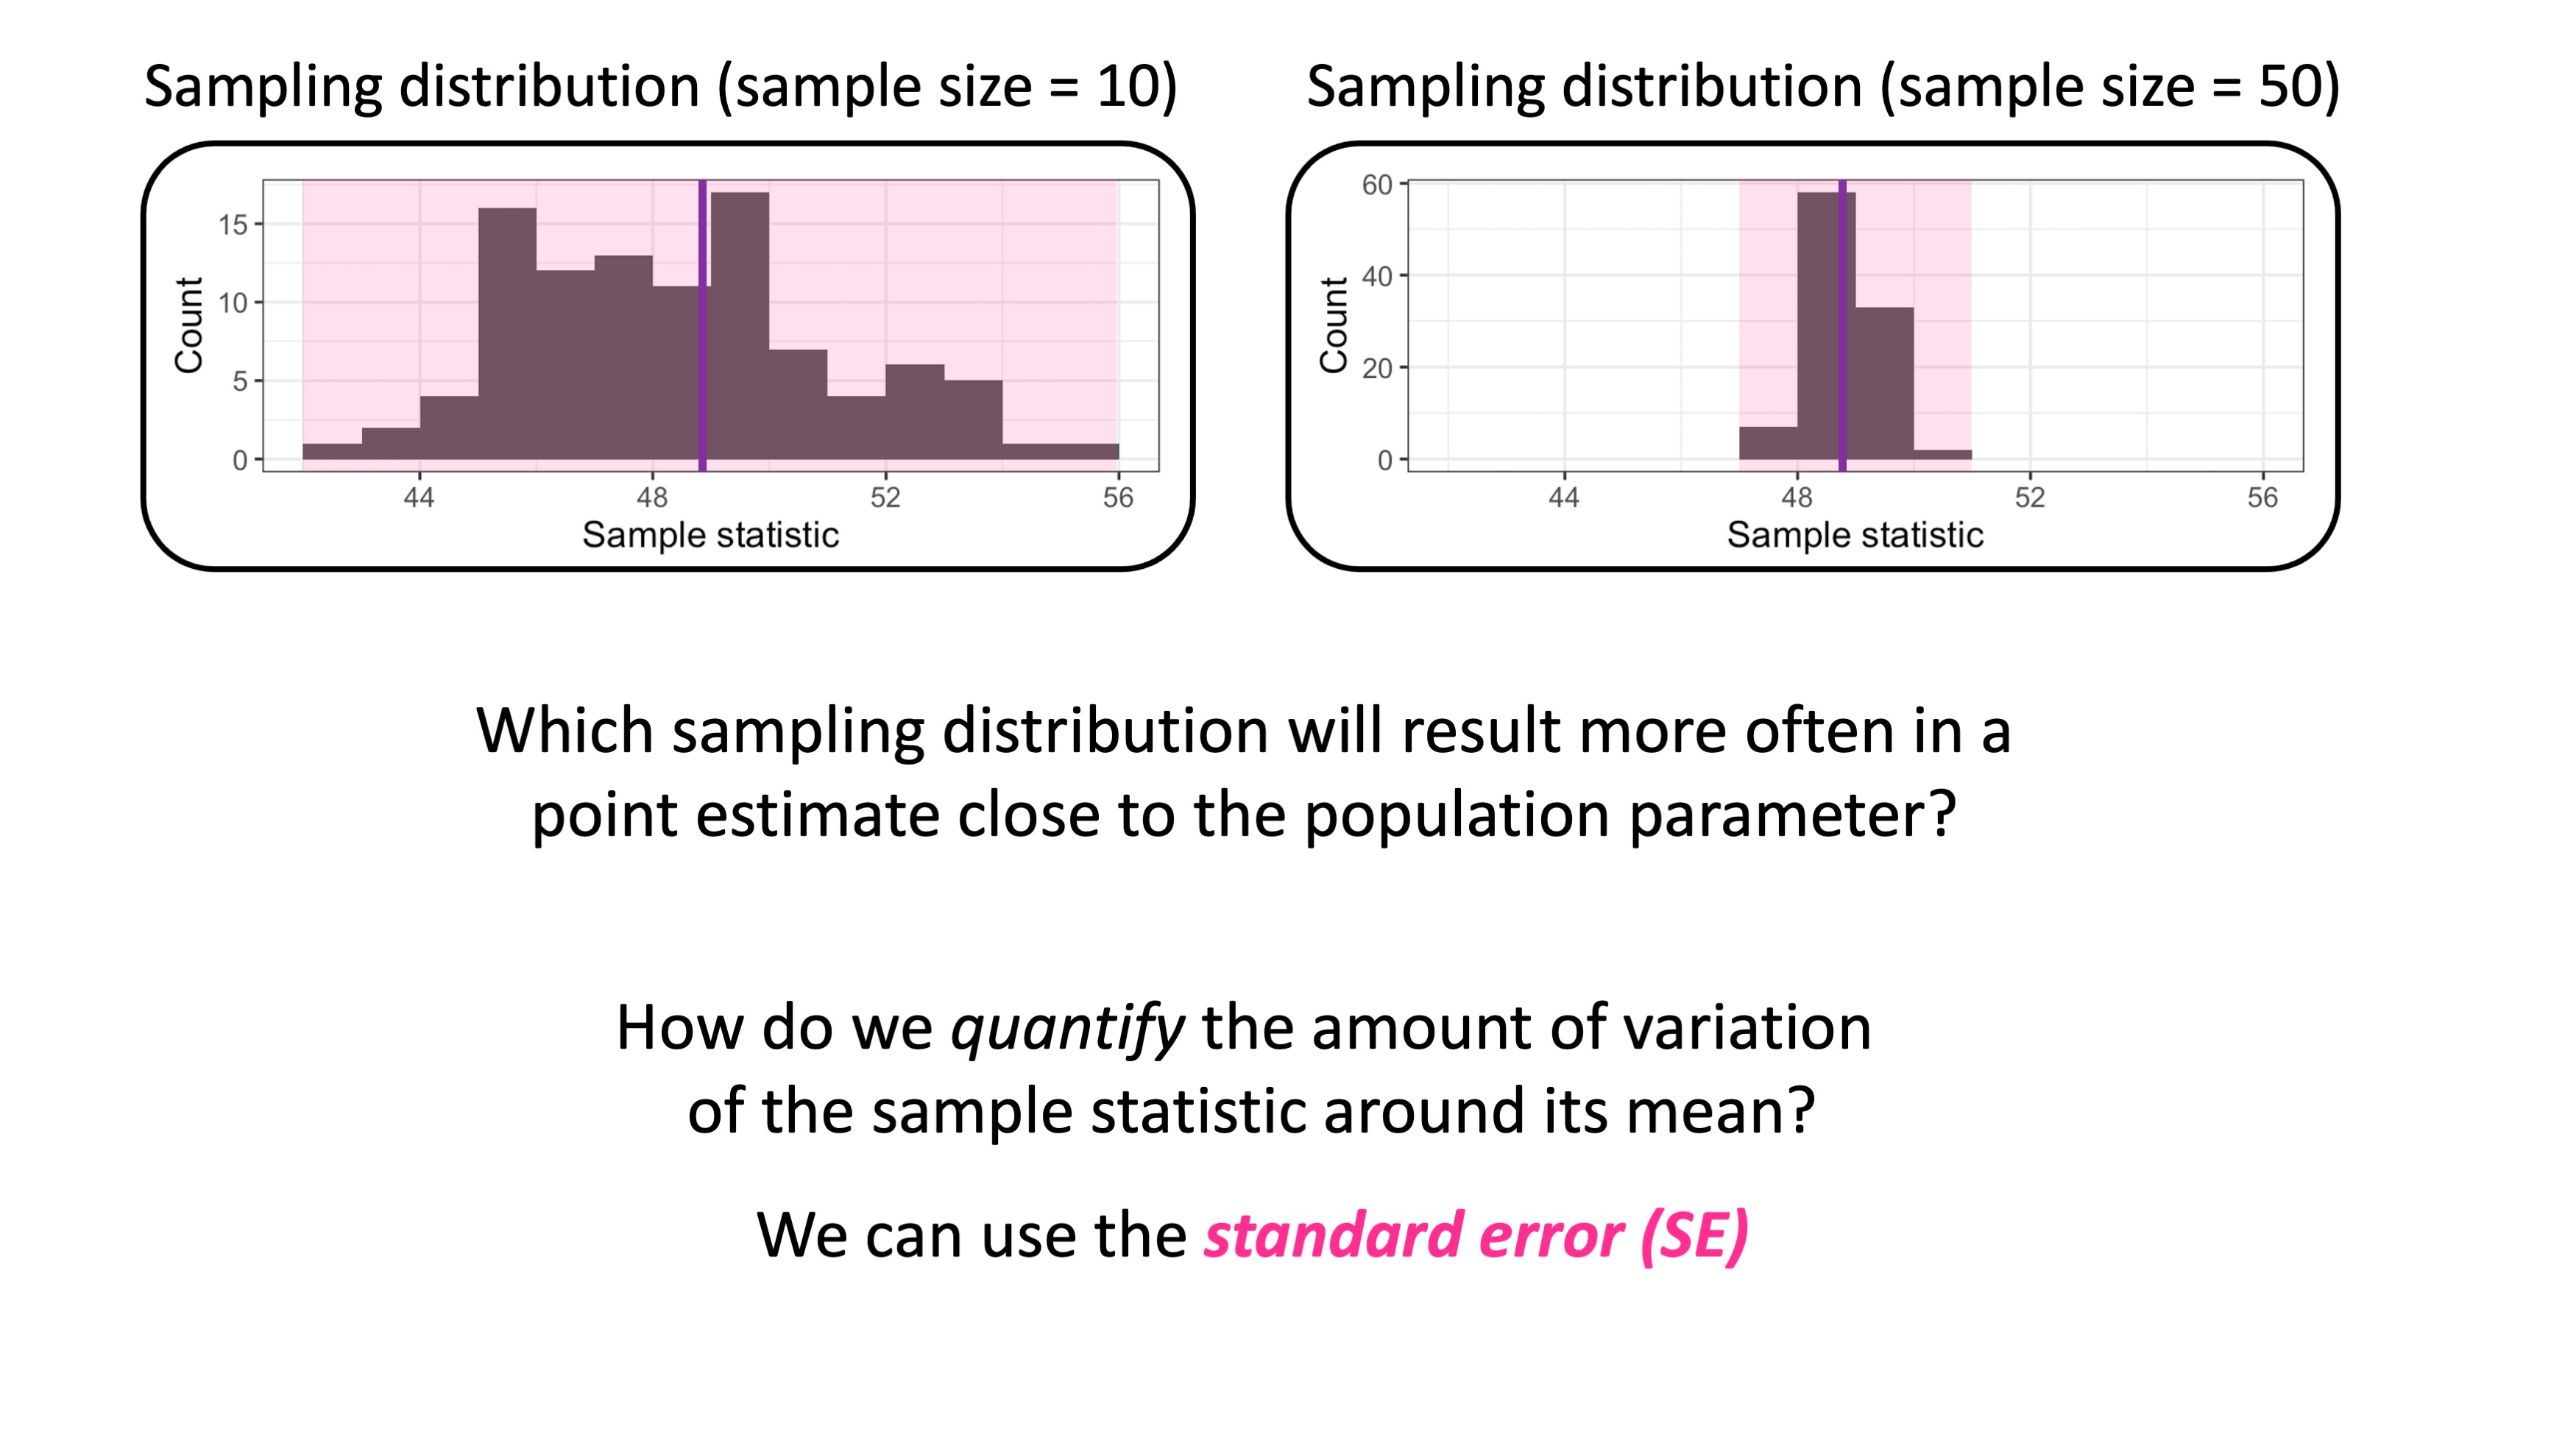
Quantifying the uncertainty with the standard error
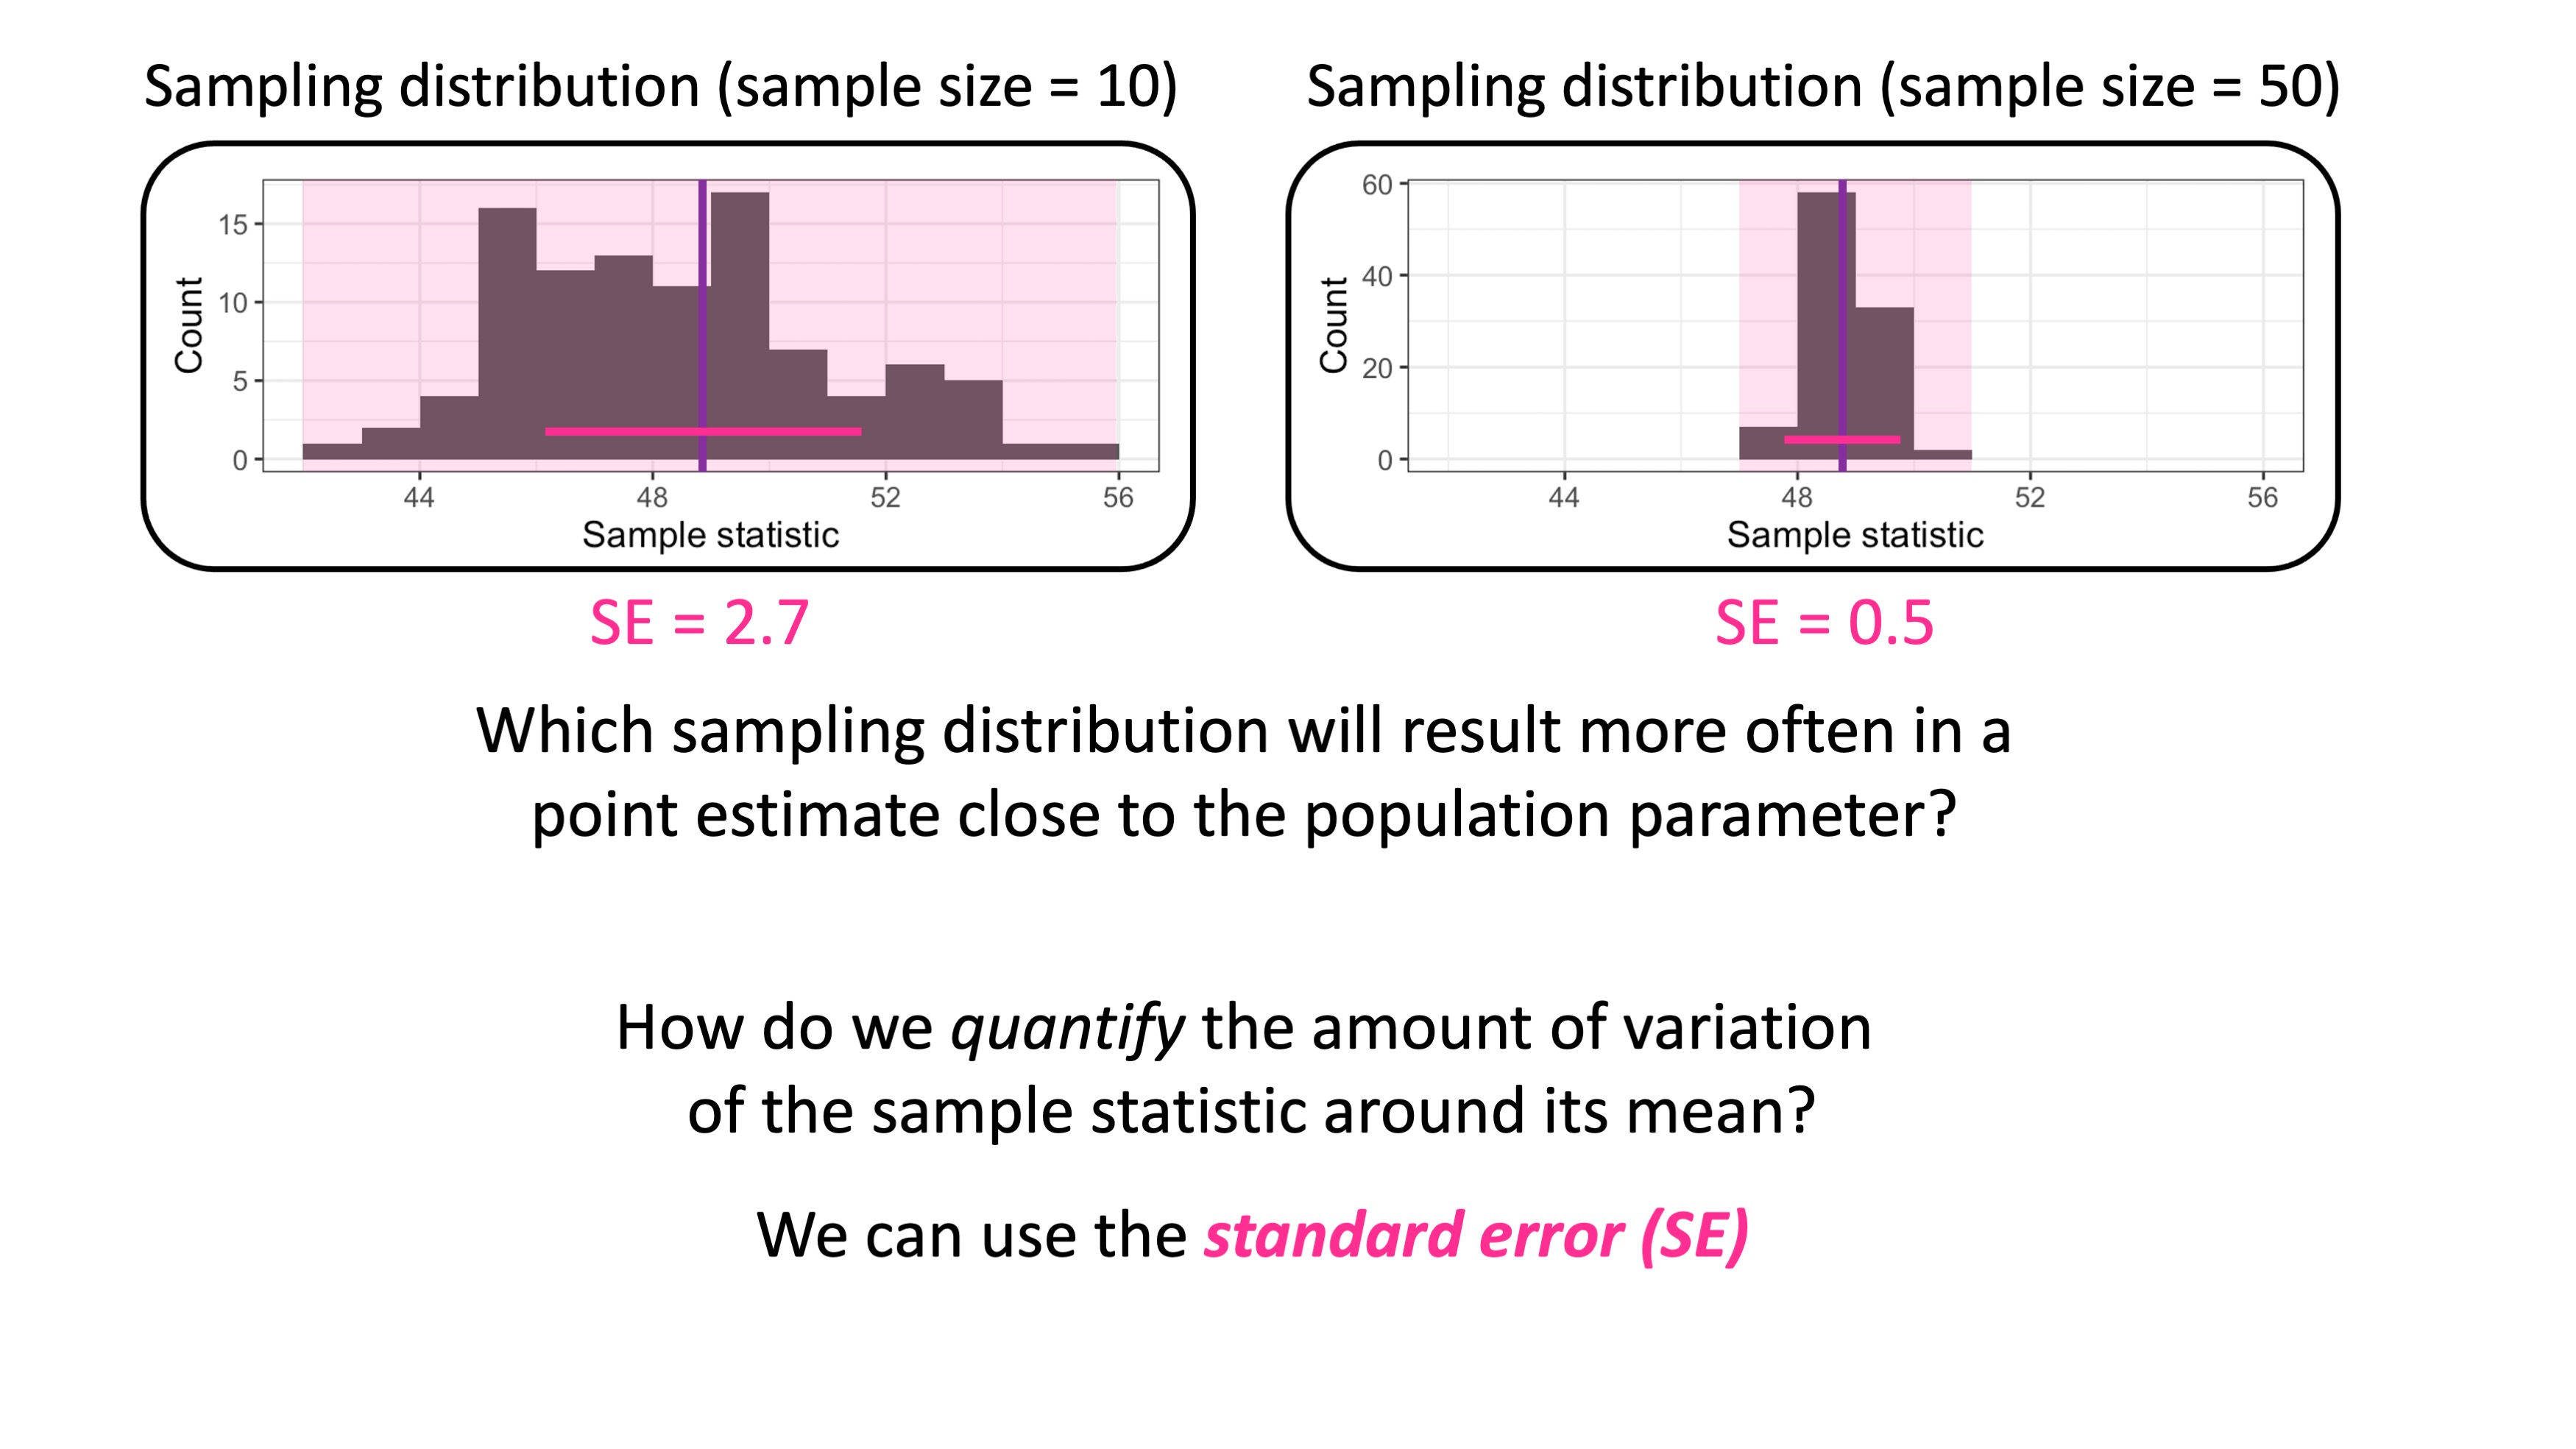
What is the standard error?
Standard error (SE) of a statistic: the standard deviation of its sampling distribution
Standard deviation (\(\sigma\) or \(s\)): the square root of the variance
- measure of the amount of variation of the values of a variable about its mean
Sampling distribution - Part I
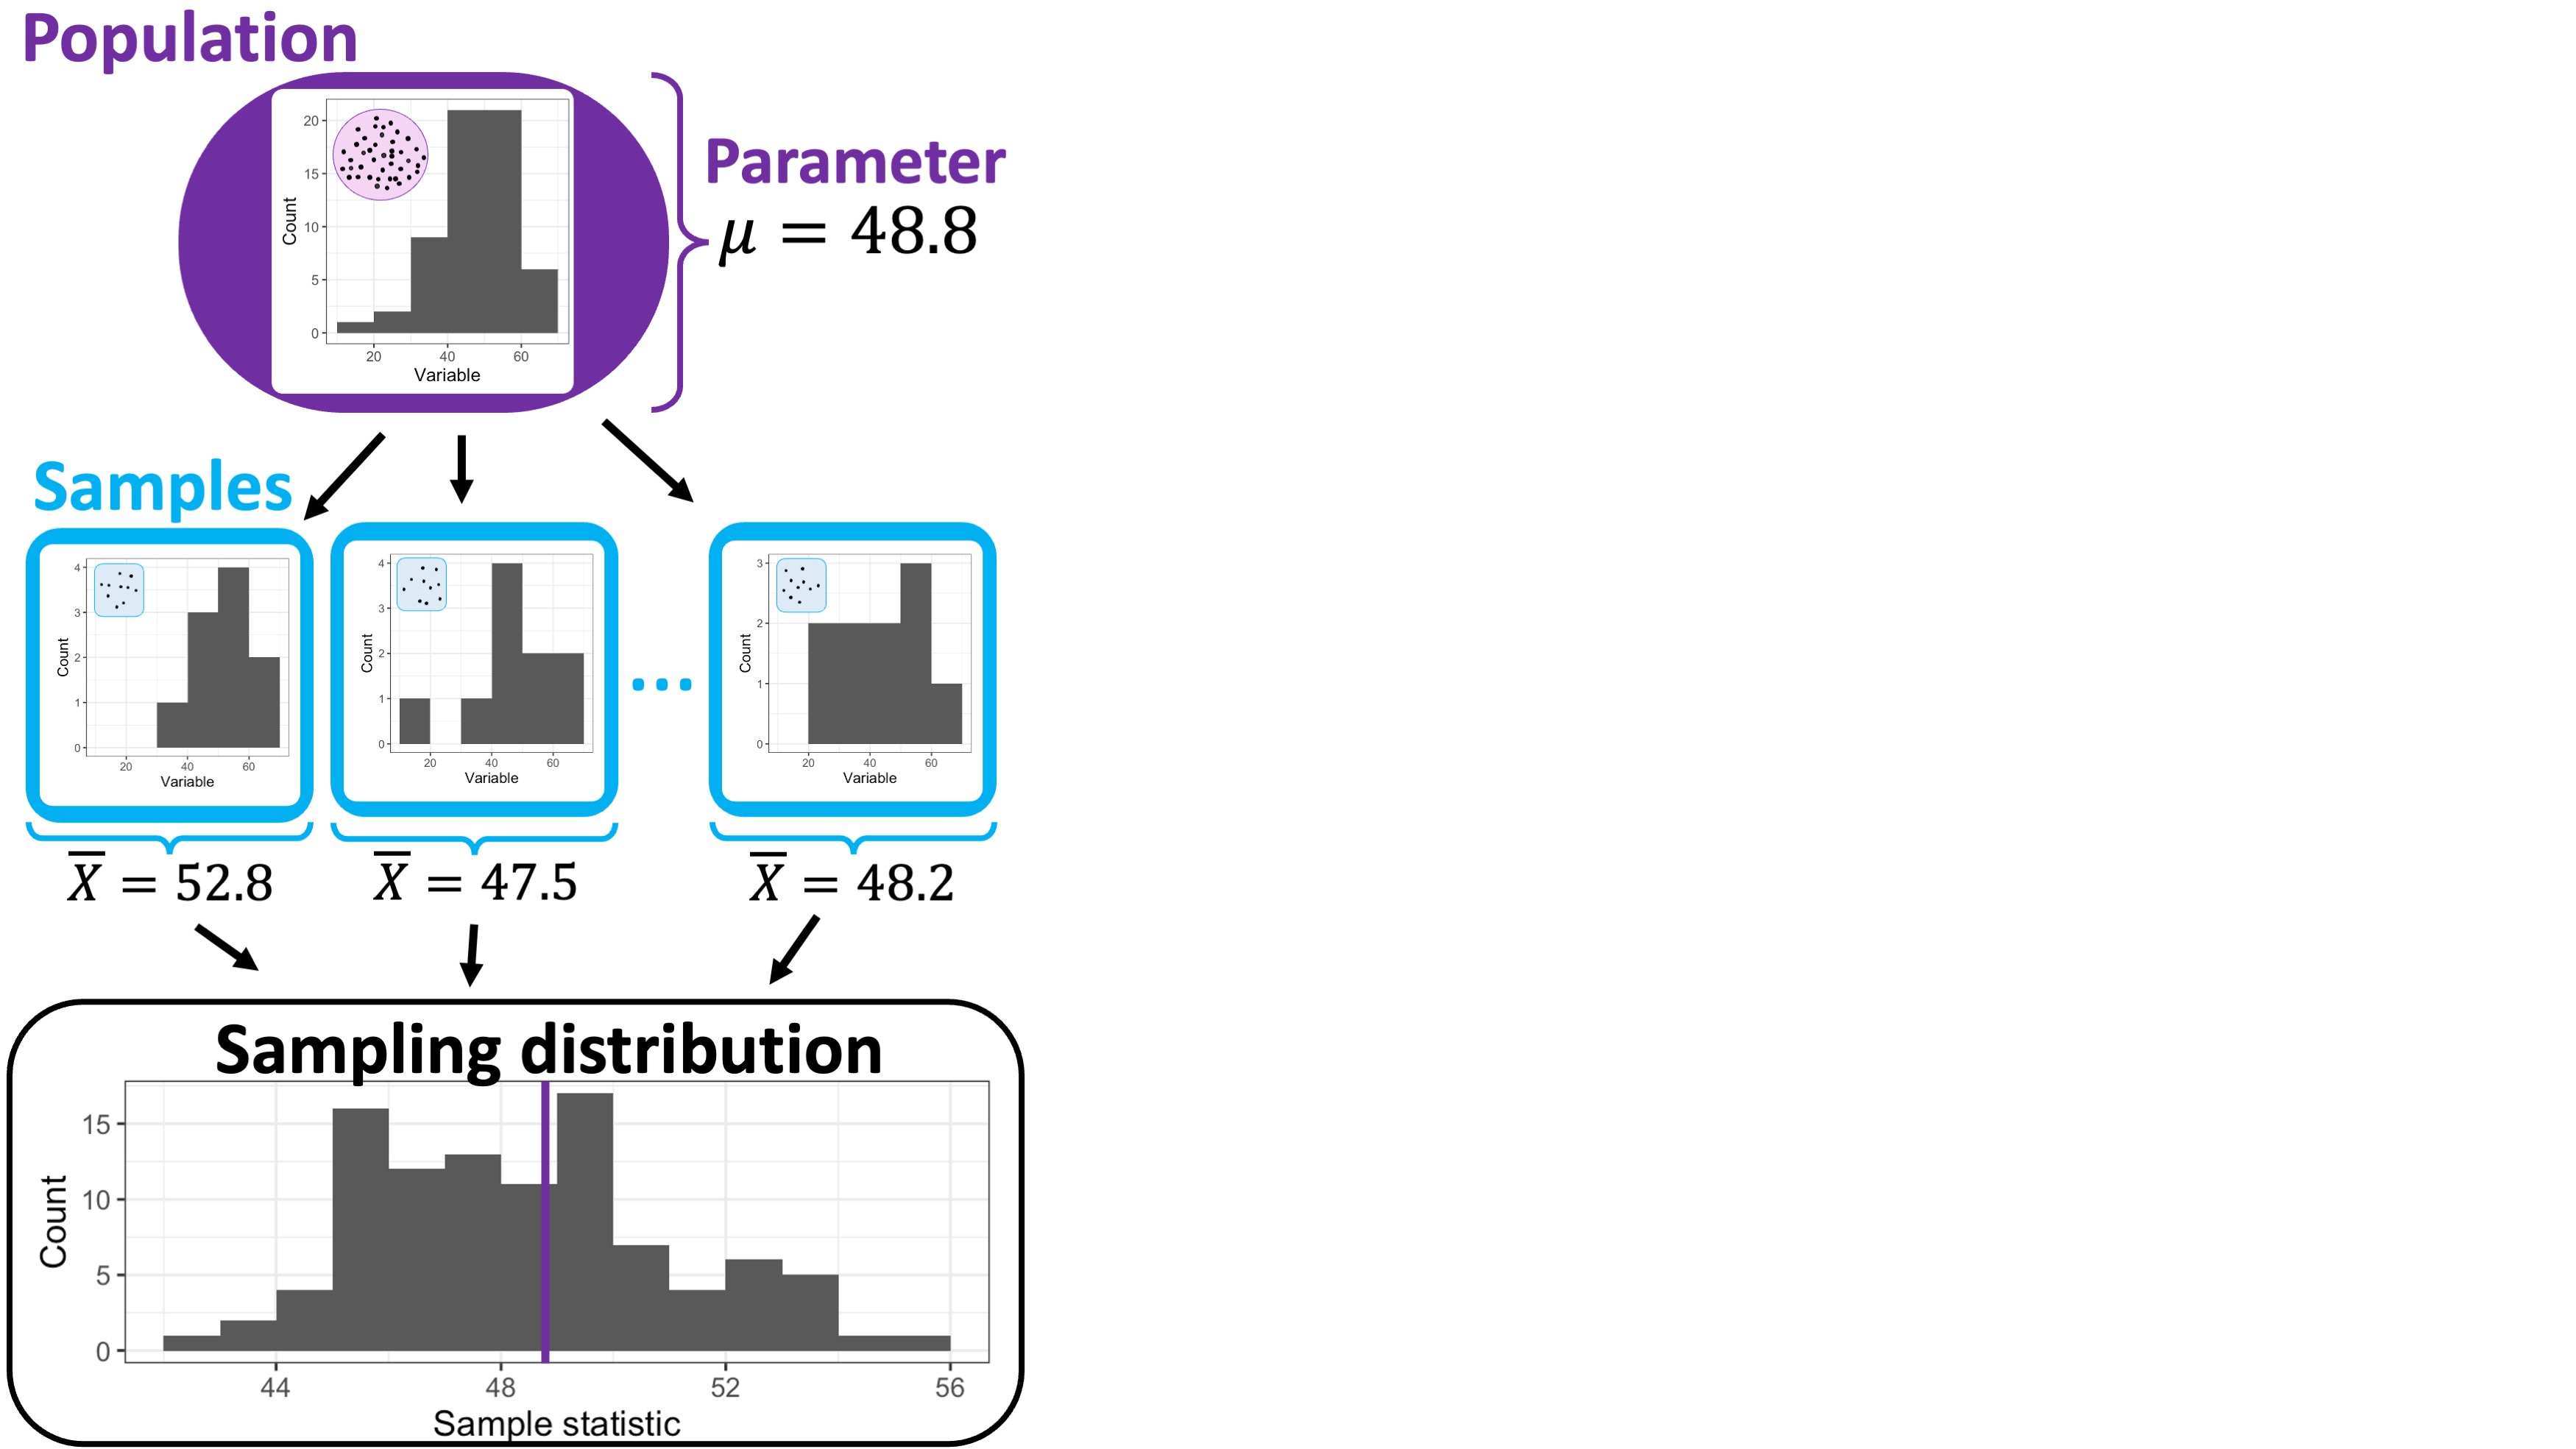
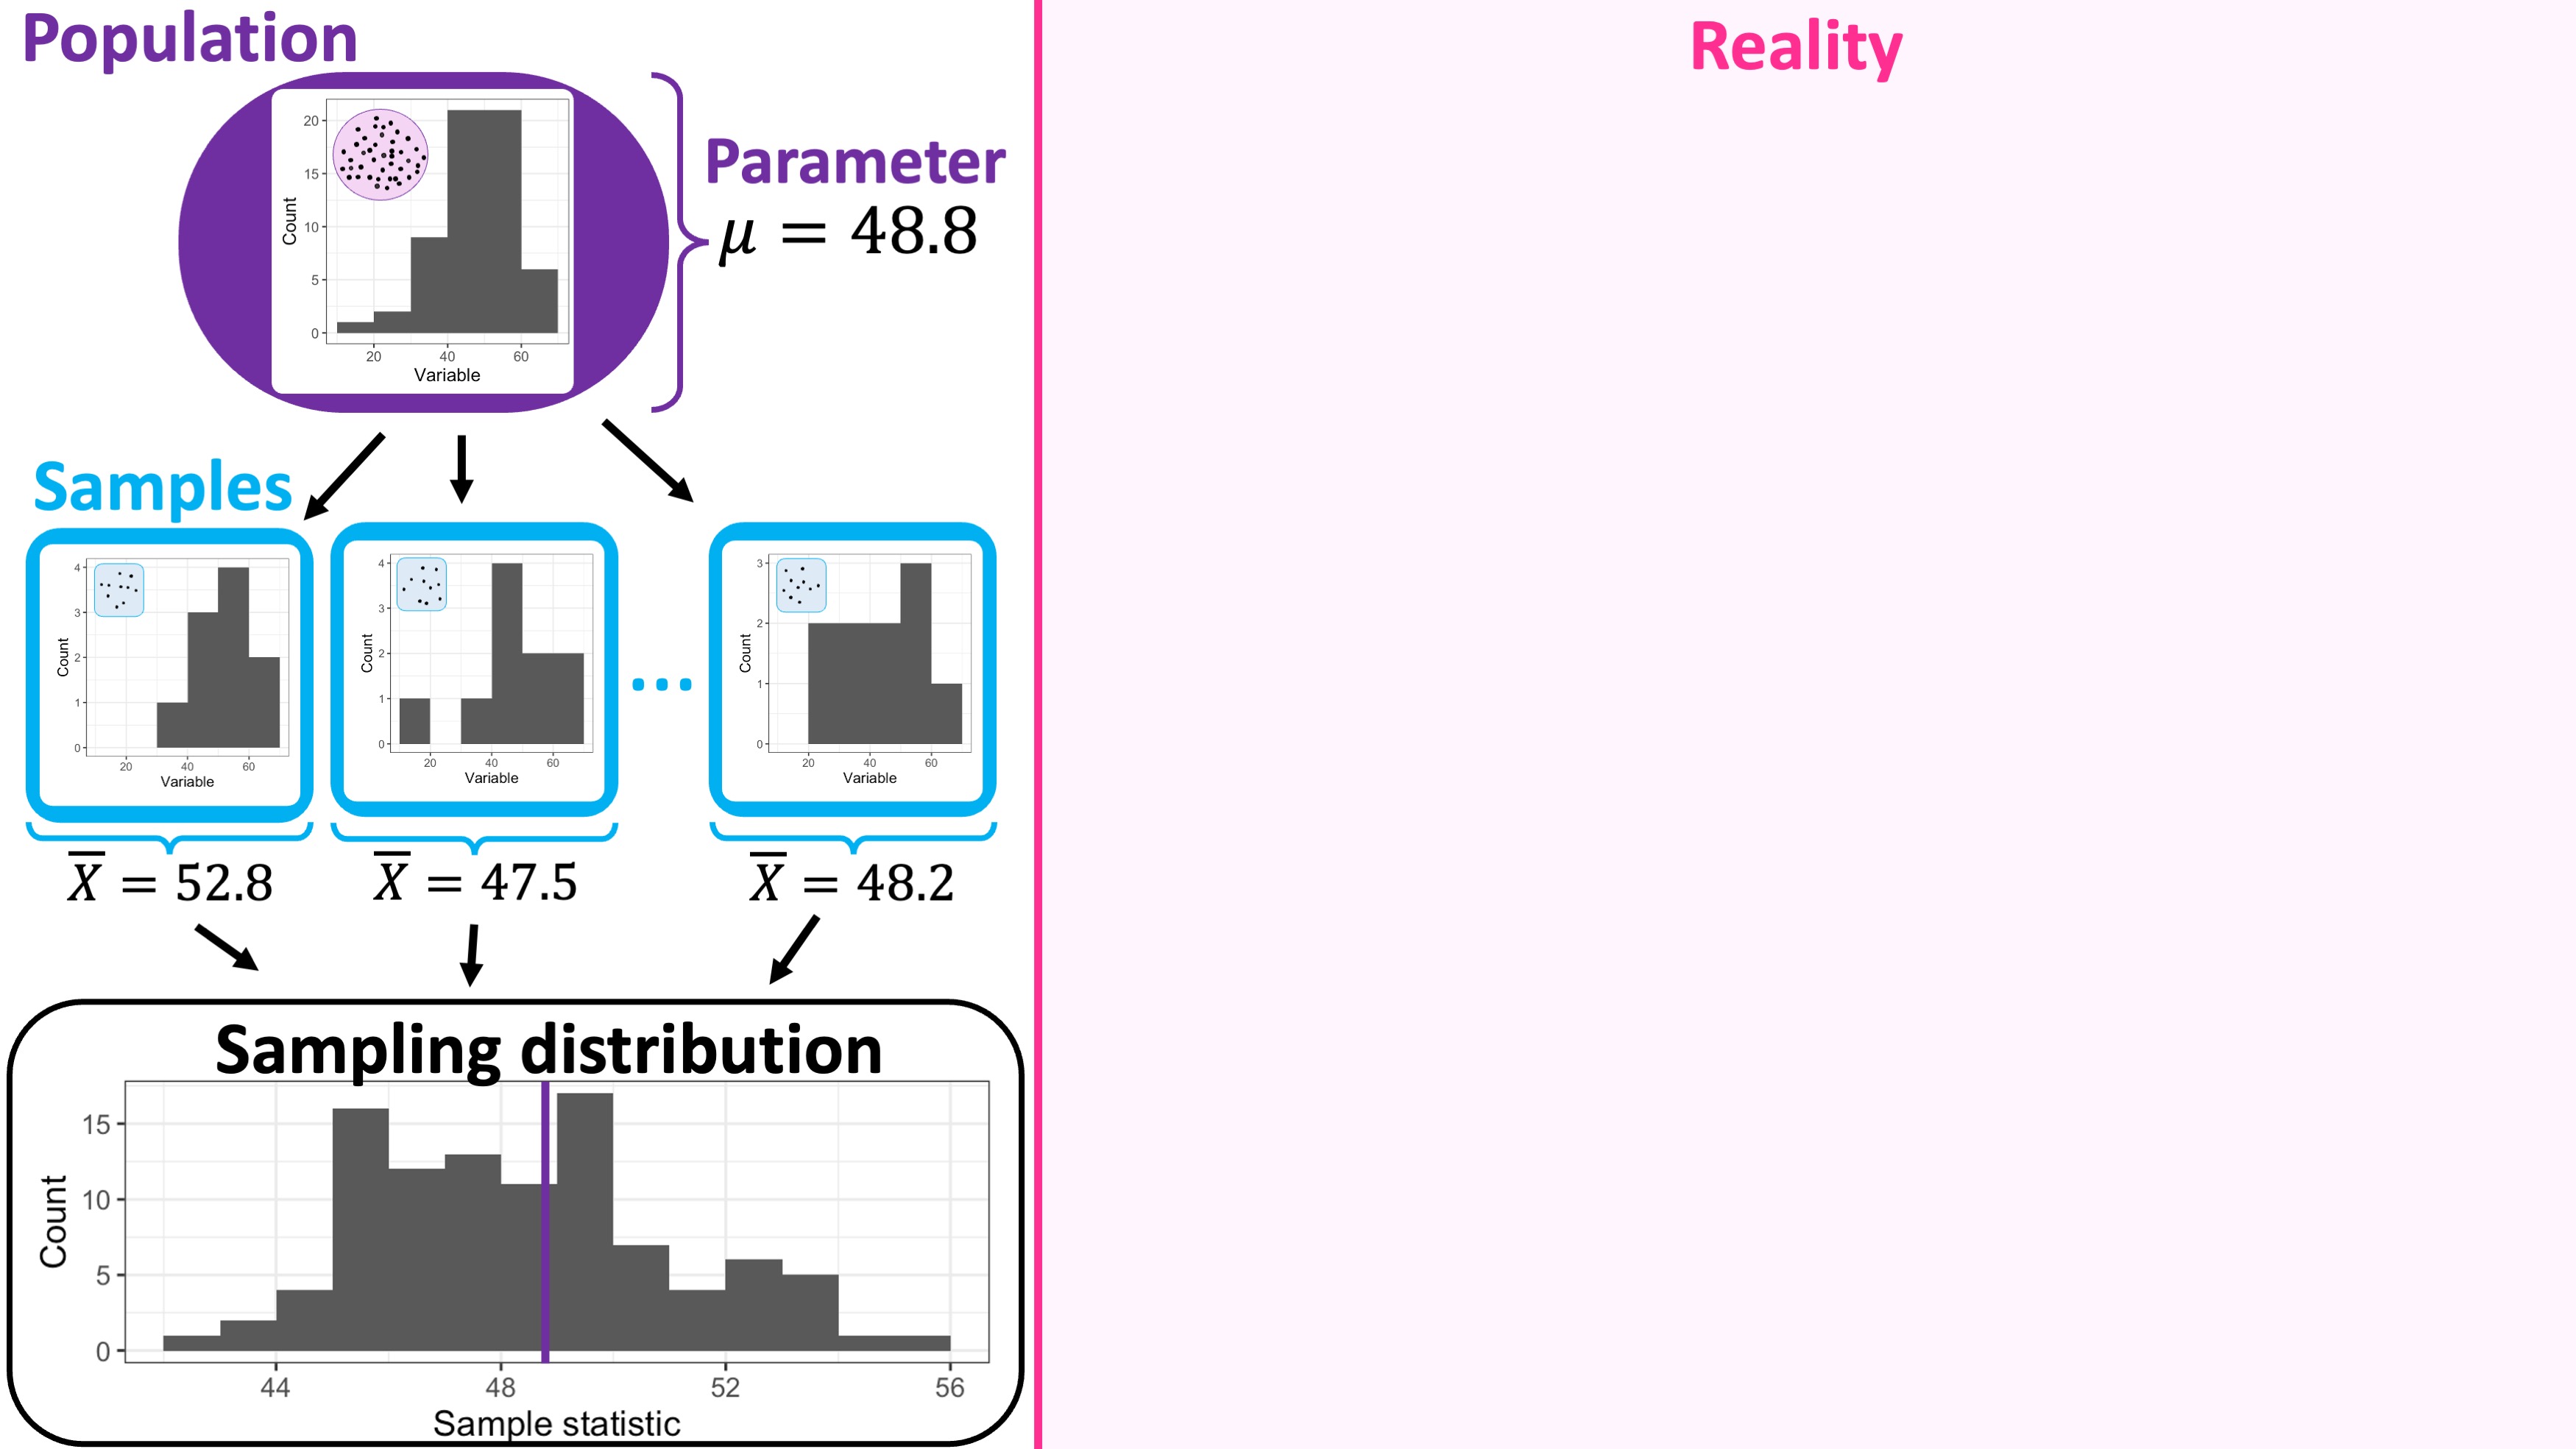
Sampling distribution is the distribution of a statistic across all possible samples;
Things that affect the sampling distribution:
- Population
- Sample Size
- Statistic
Once you have all three things set, the sampling distribution is fixed but unknown;
Sampling distribution - Part II
- Technically, when you know the population, you could potentially obtain the exact sampling distribution;
- Calculate the statistic across all possible samples (like we did for the aquarium example in Lecture 1)
- But this is only manageable for very tiny problems.
- For example, for a population of size \(200\) and samples of size \(20\), we need to consider 1613587787967350602876321792 possible samples.
- this is still a very small population and sample!!
Sampling distribution - Part III
- Since we cannot evaluate all possible samples, we take many samples from the population to approximate the sampling distribution;
- this approximation (not the sampling distribution) depends on the samples we draw;
Attention
- You NEVER know the population in practice!!!!
- If you do, you don’t need statistics.
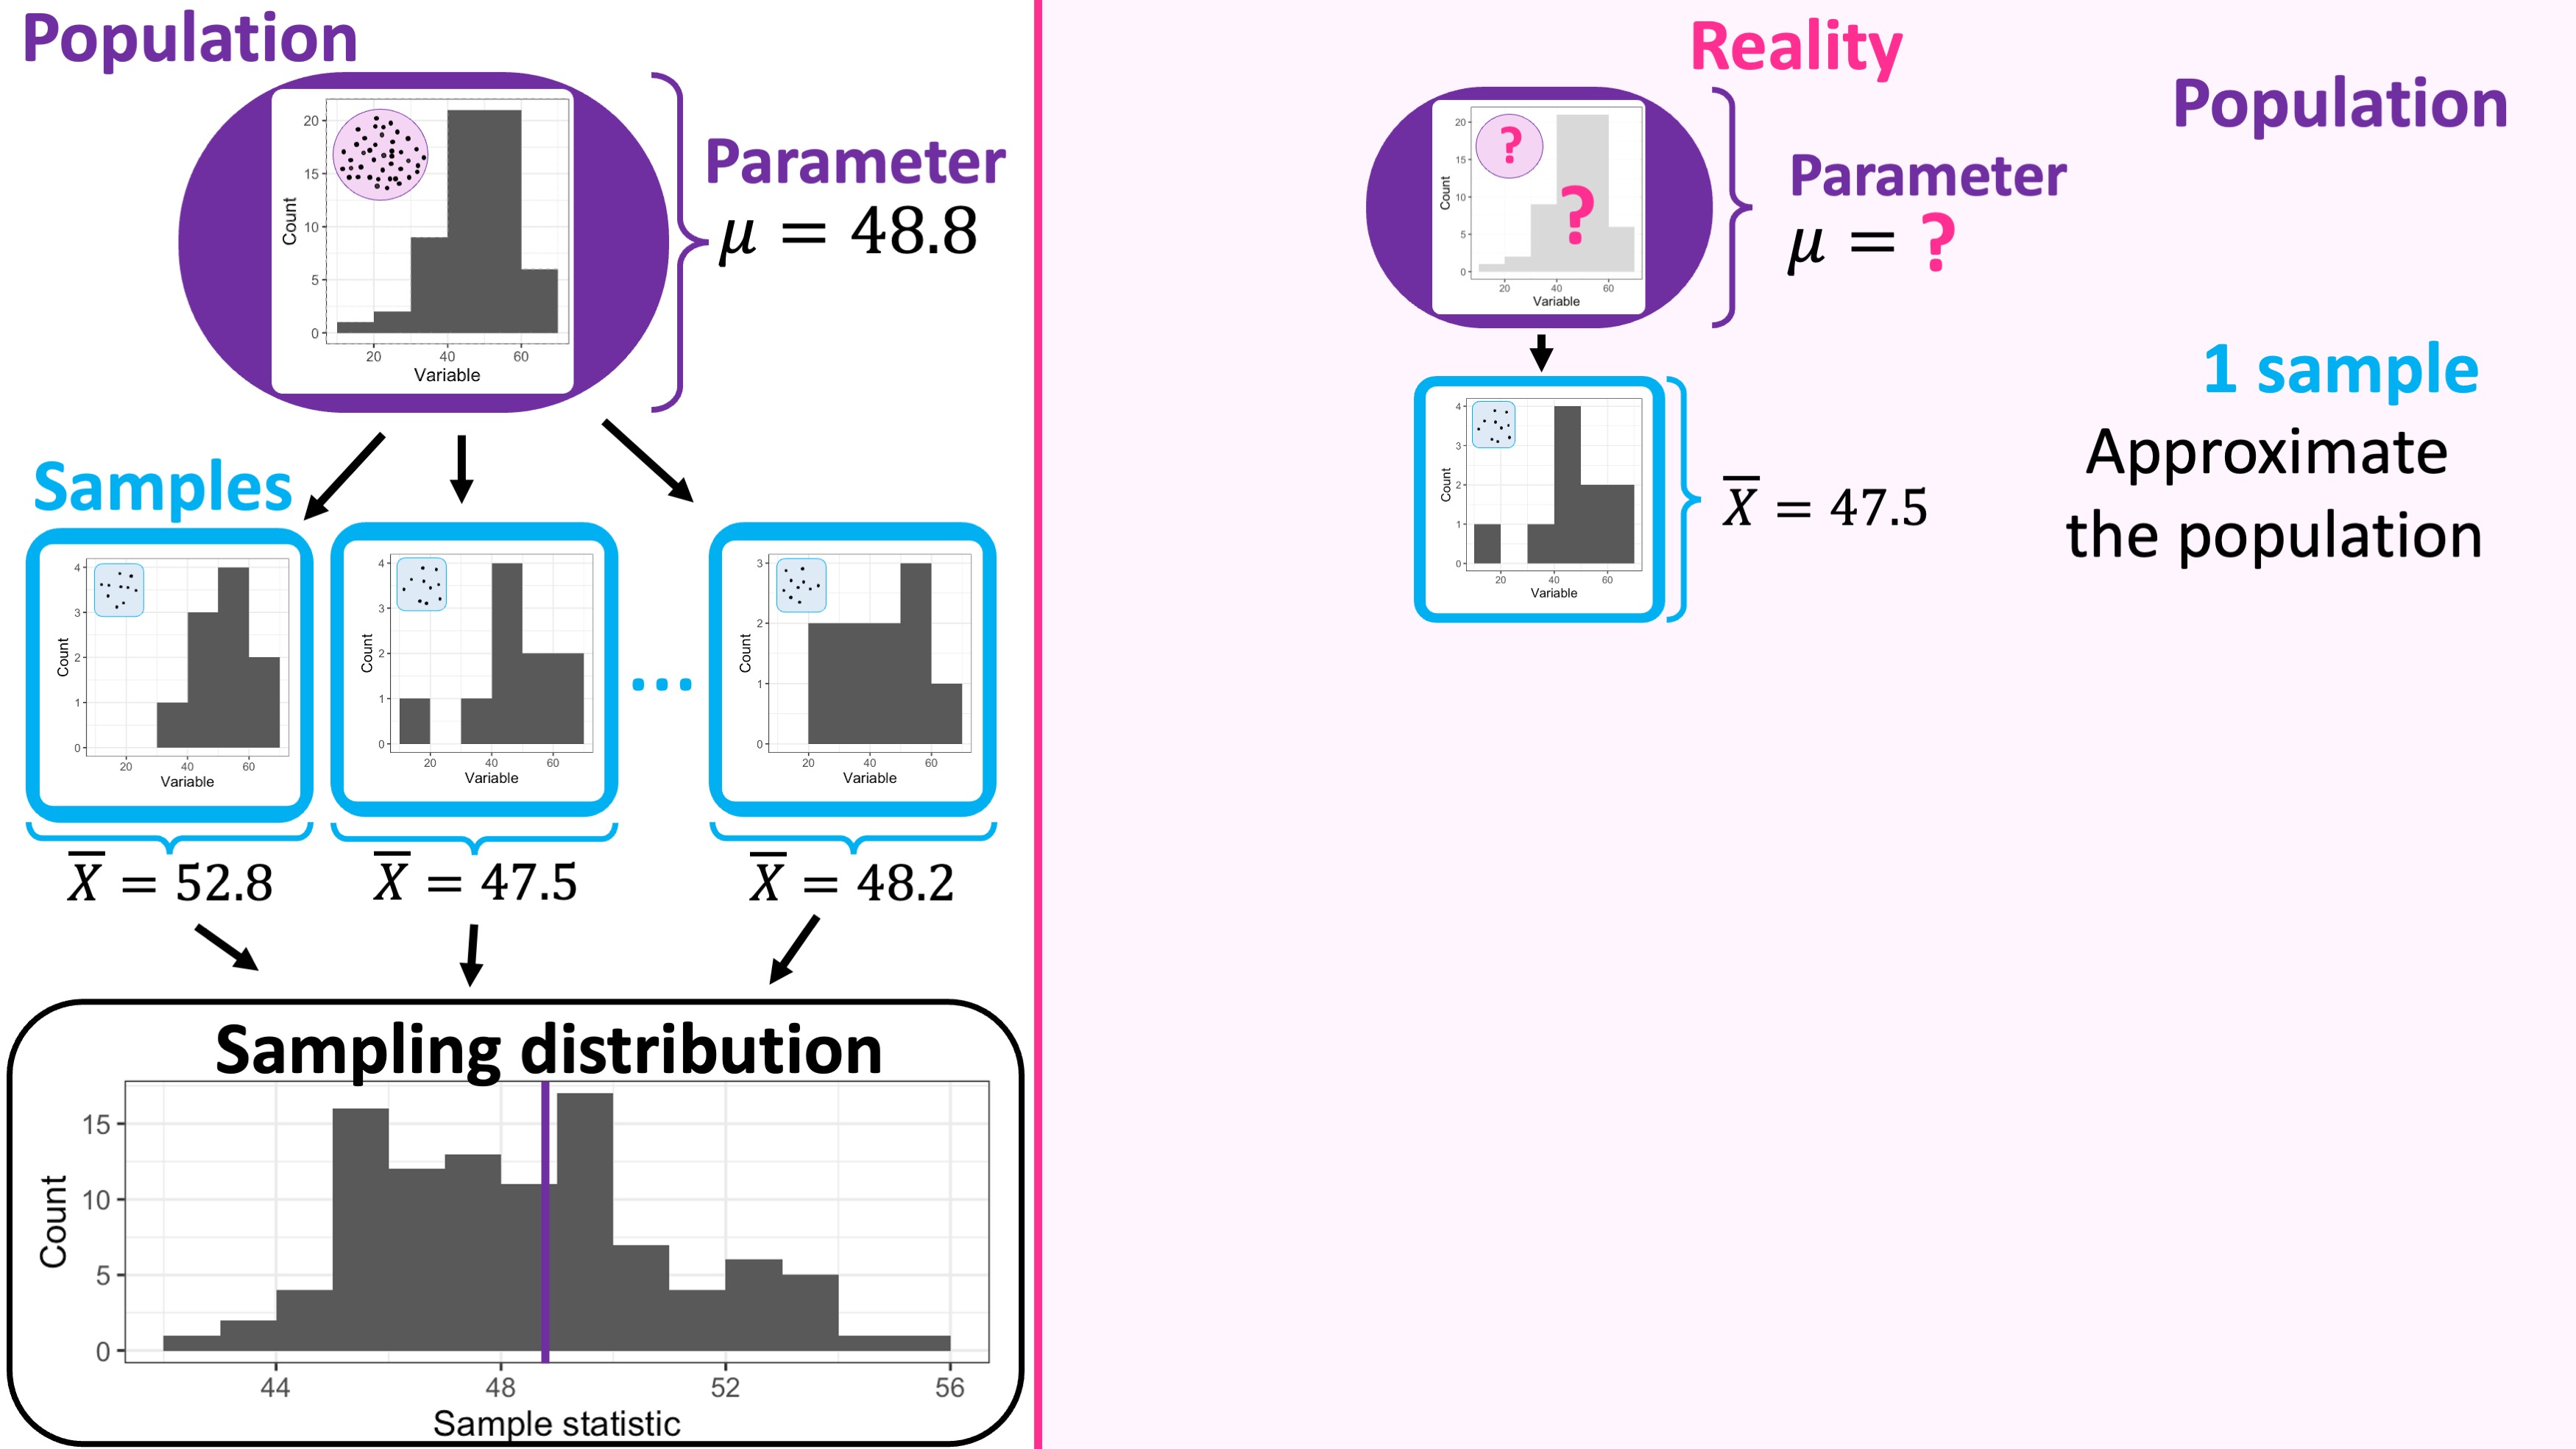
- You NEVER take multiple samples – you take one sample as large as you can
- Why?
- So how do we estimate the sampling distribution?
Approximating the sampling distribution with bootstrapping
Estimating the sampling distribution with bootstrapping
Estimating the sampling distribution with bootstrapping
Estimating the sampling distribution with bootstrapping
Estimating the sampling distribution with bootstrapping
Estimating the sampling distribution with bootstrapping
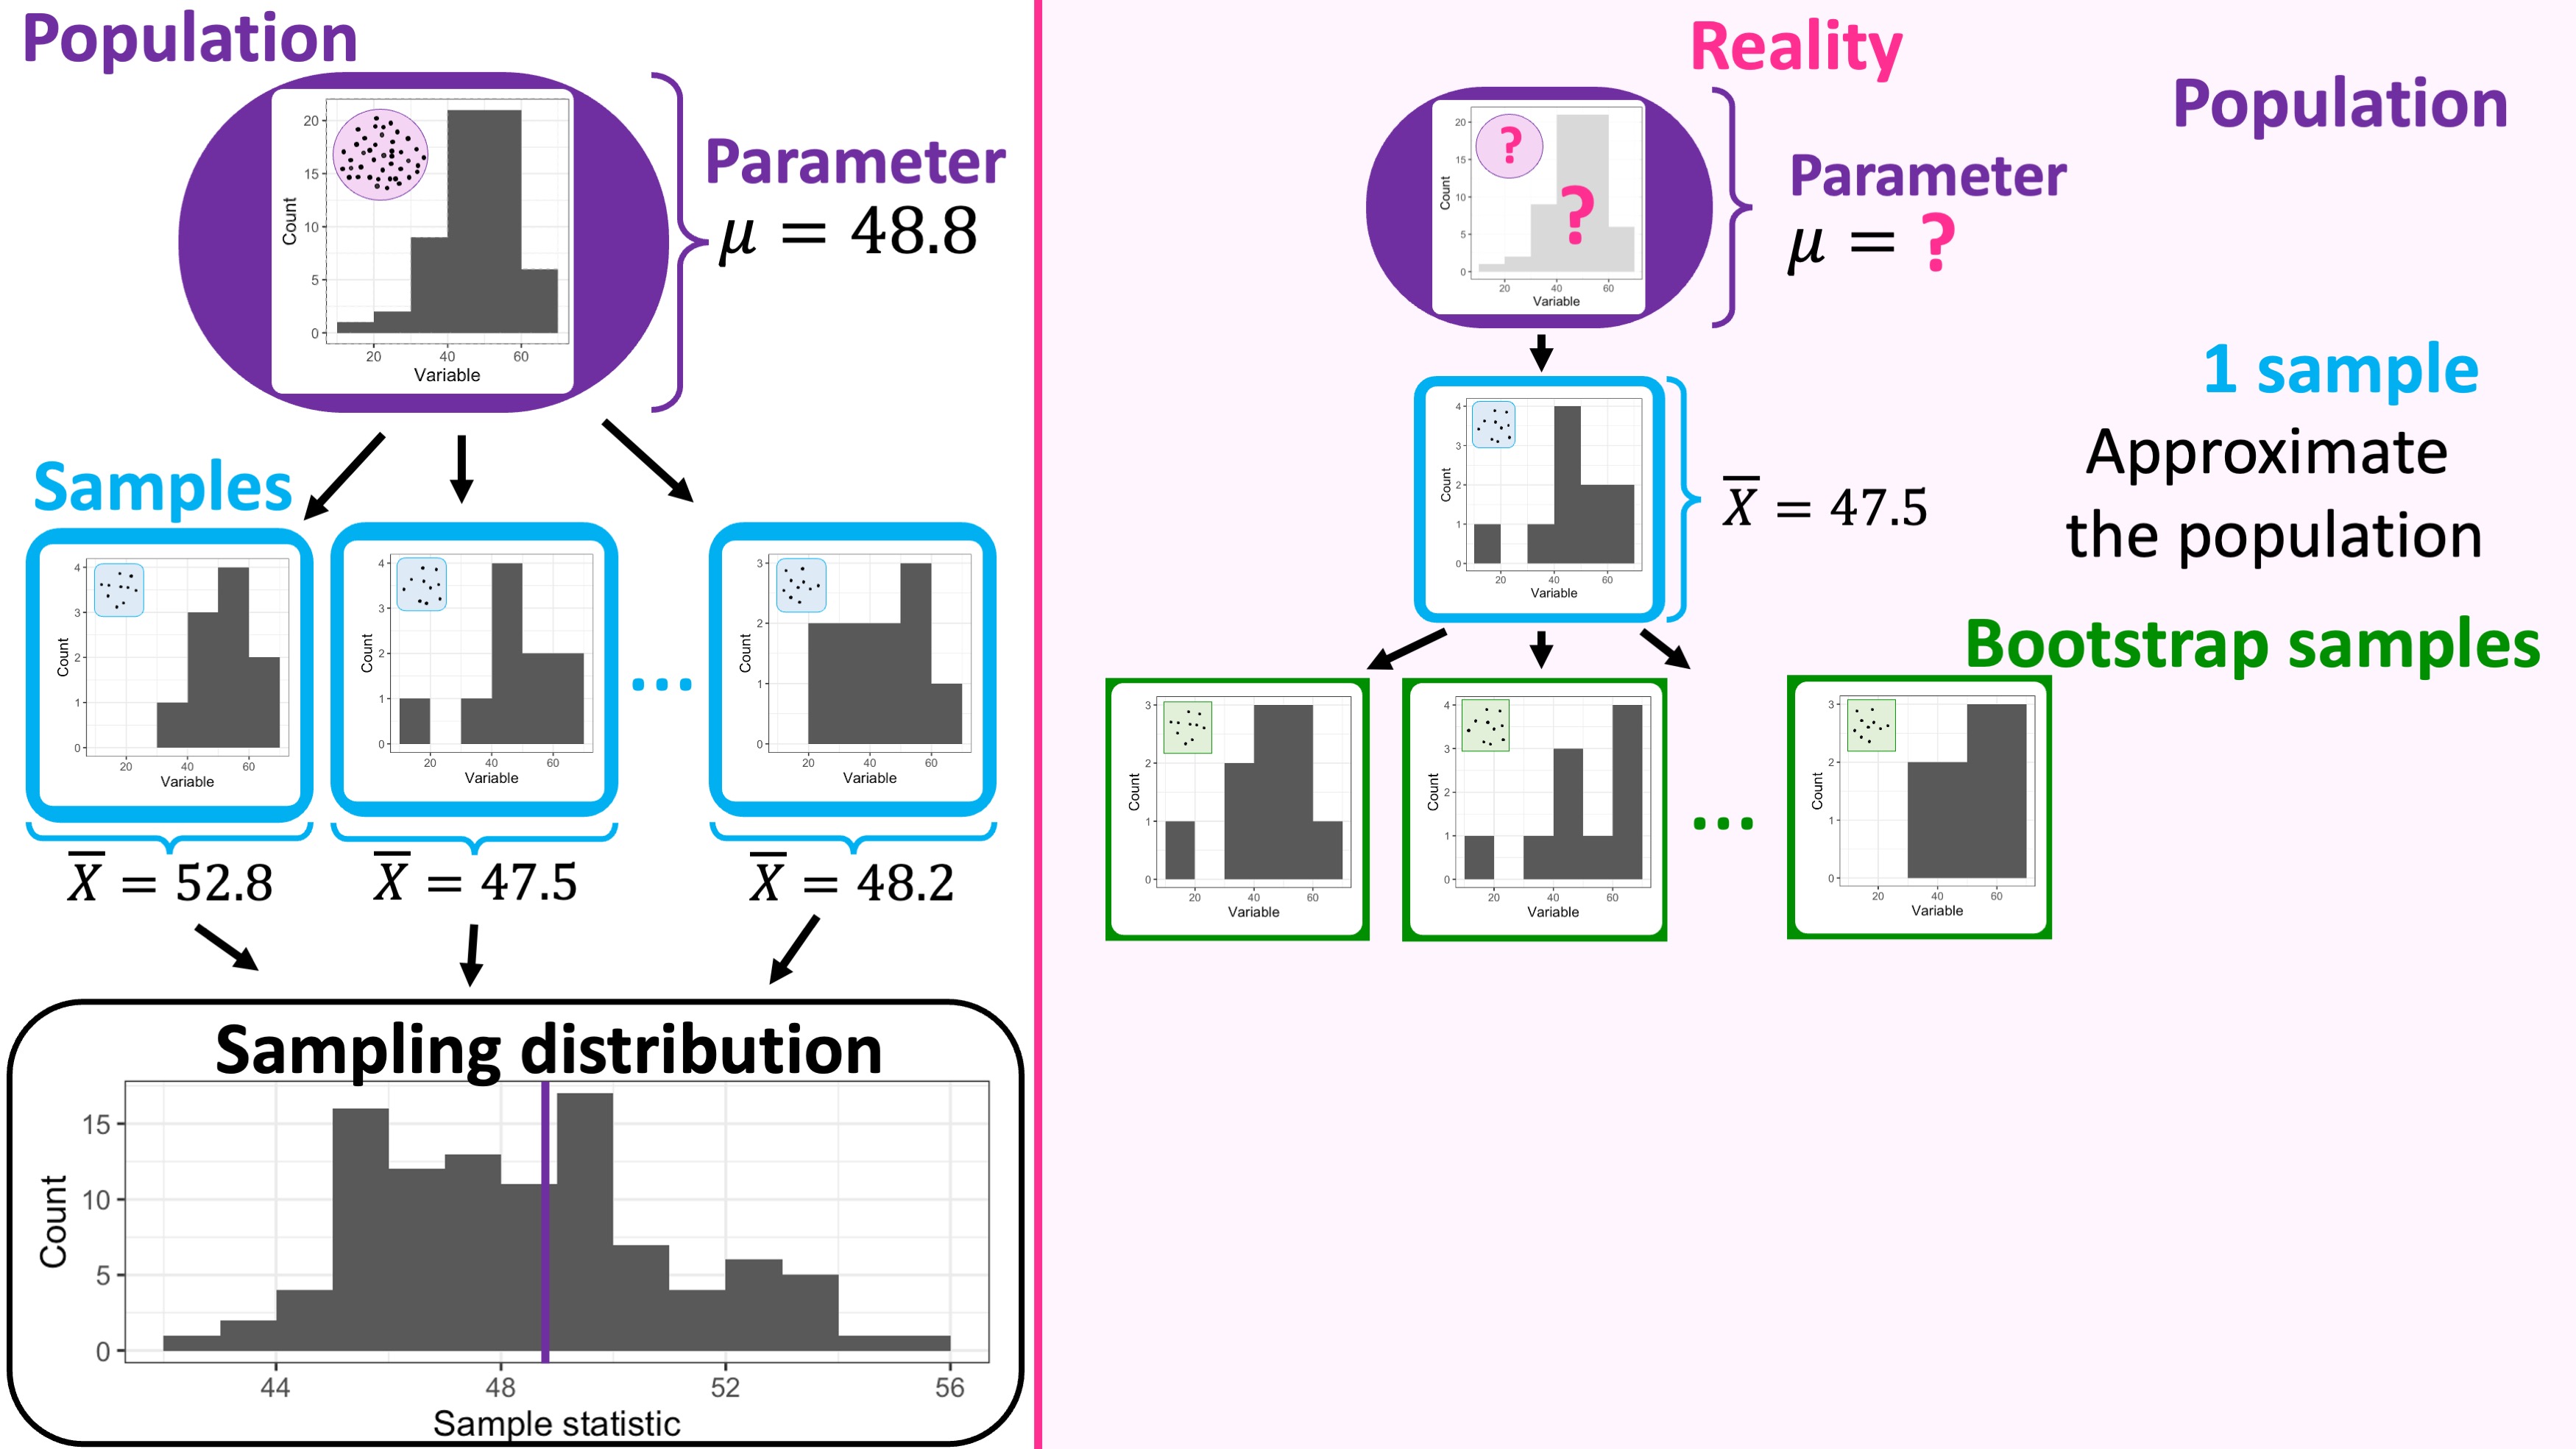
Estimating the sampling distribution with bootstrapping
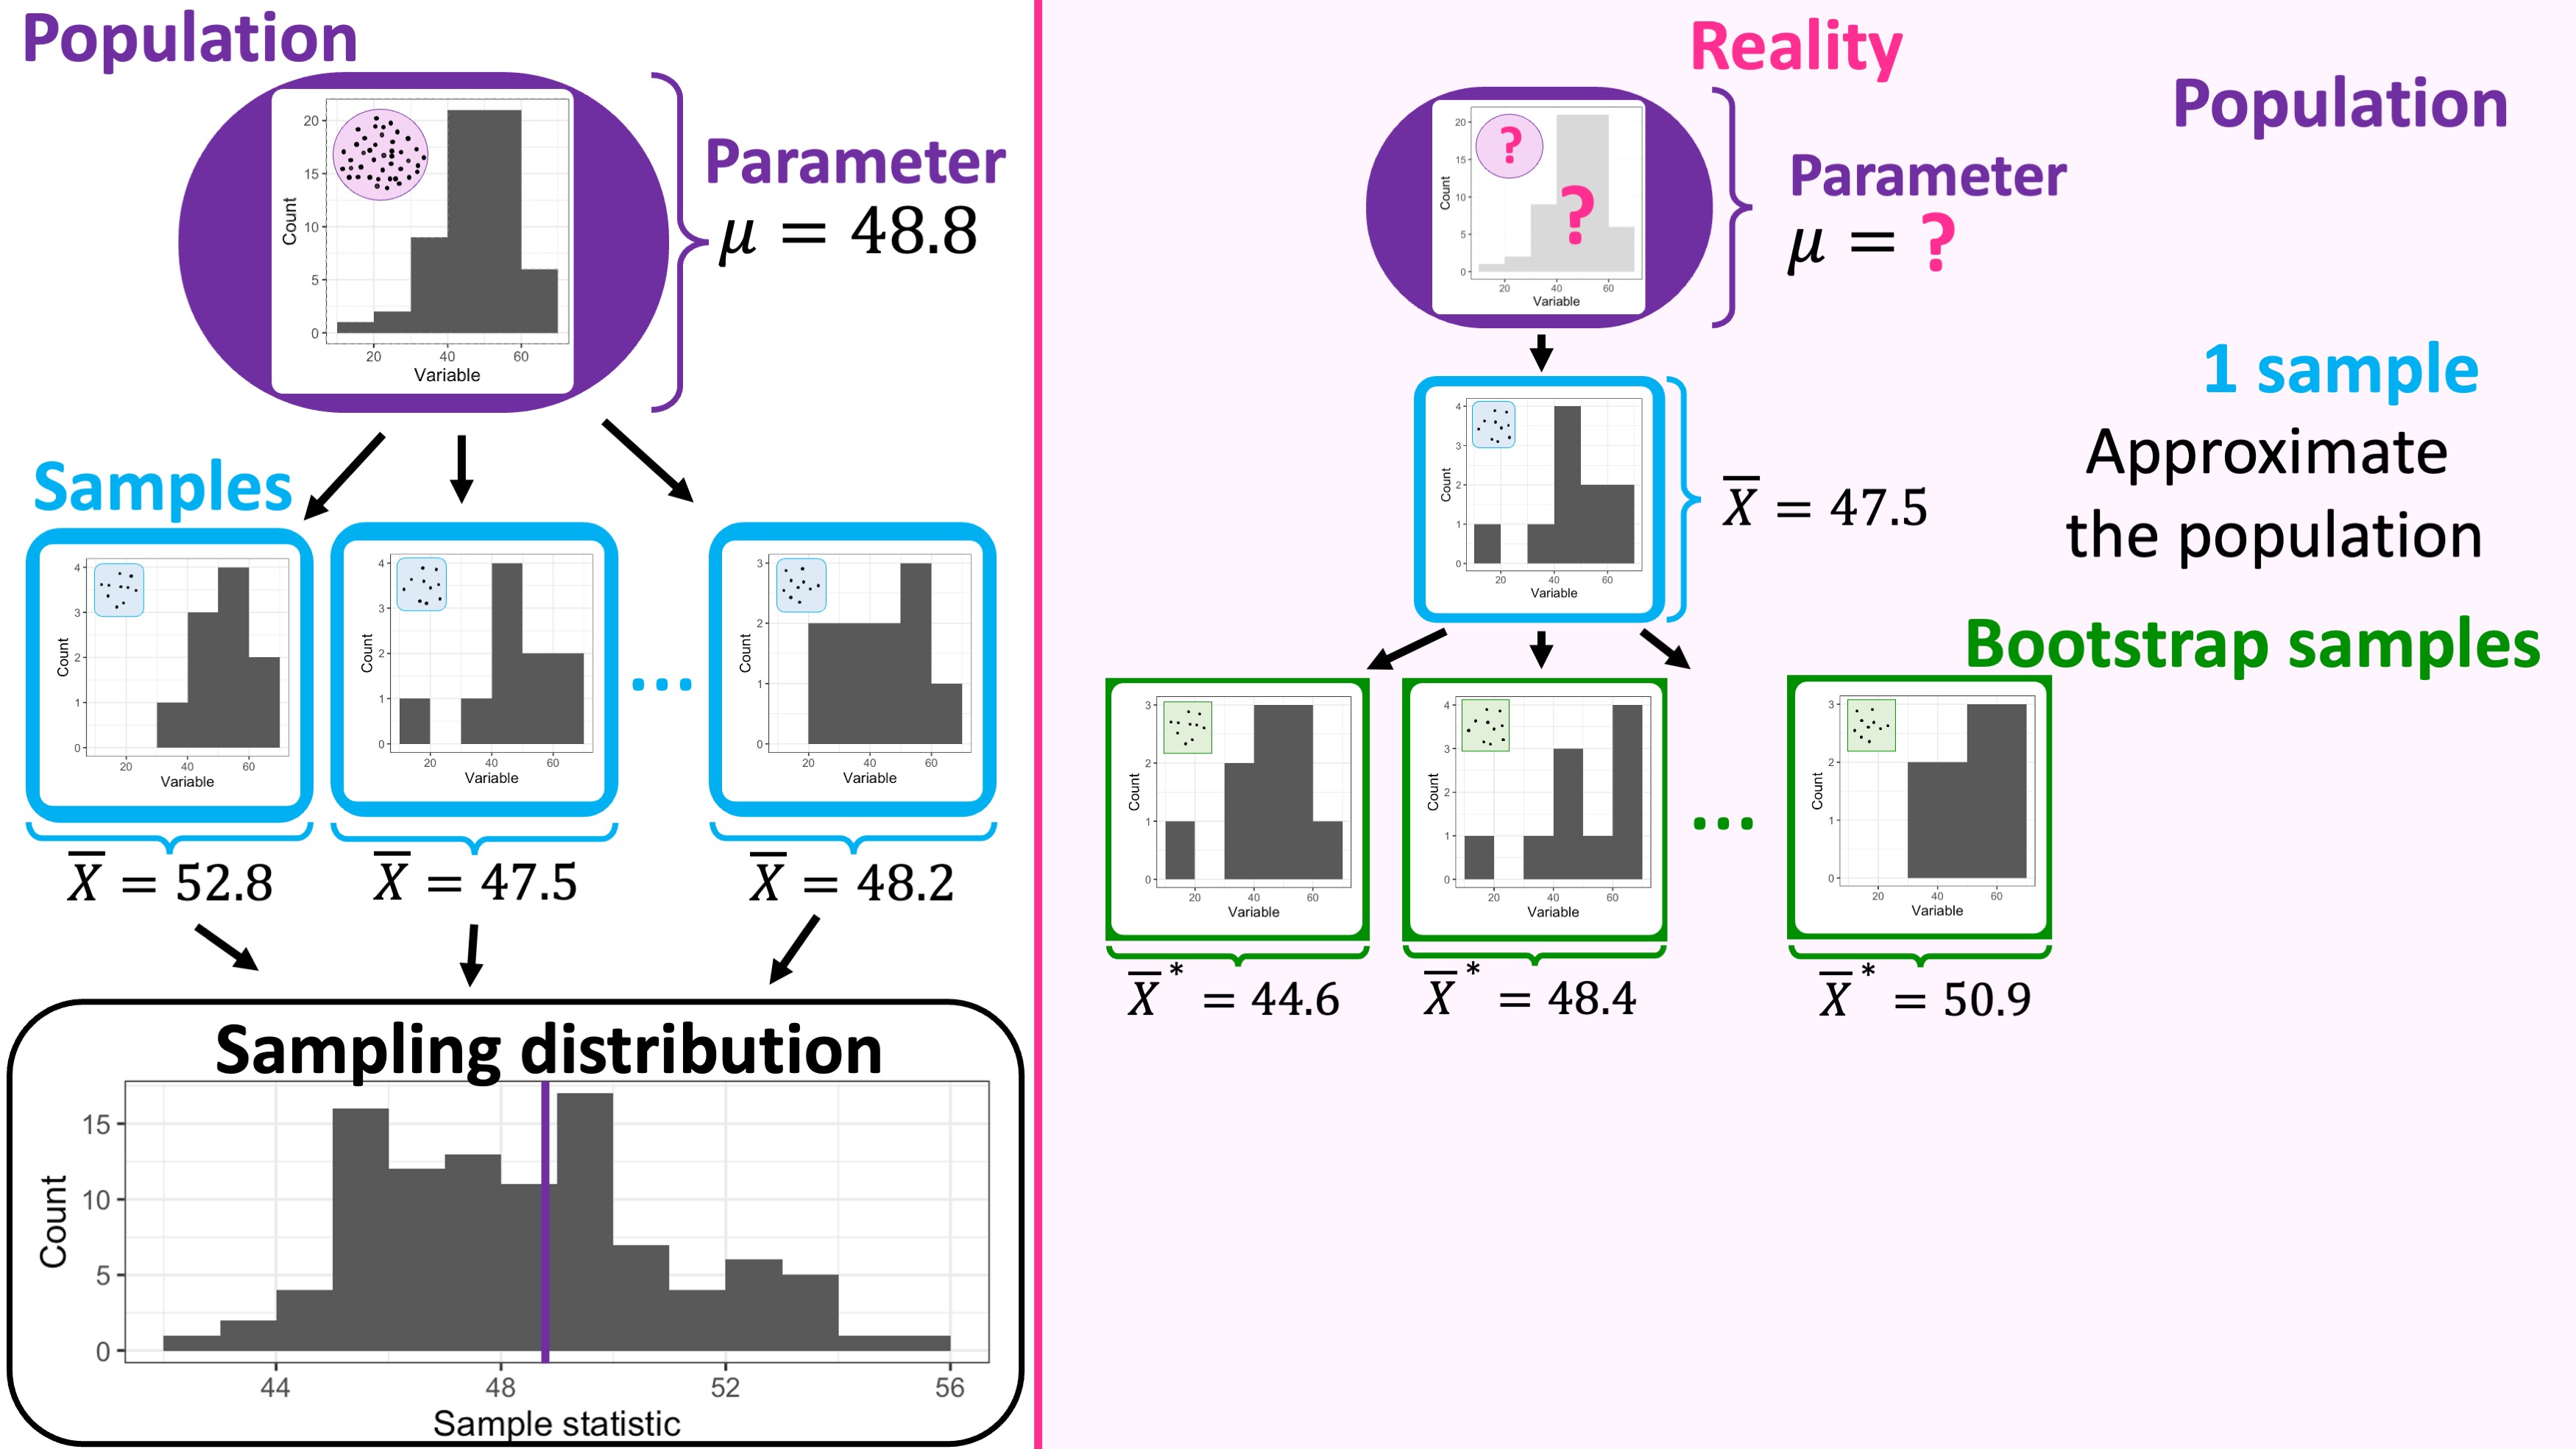
Estimating the sampling distribution with bootstrapping
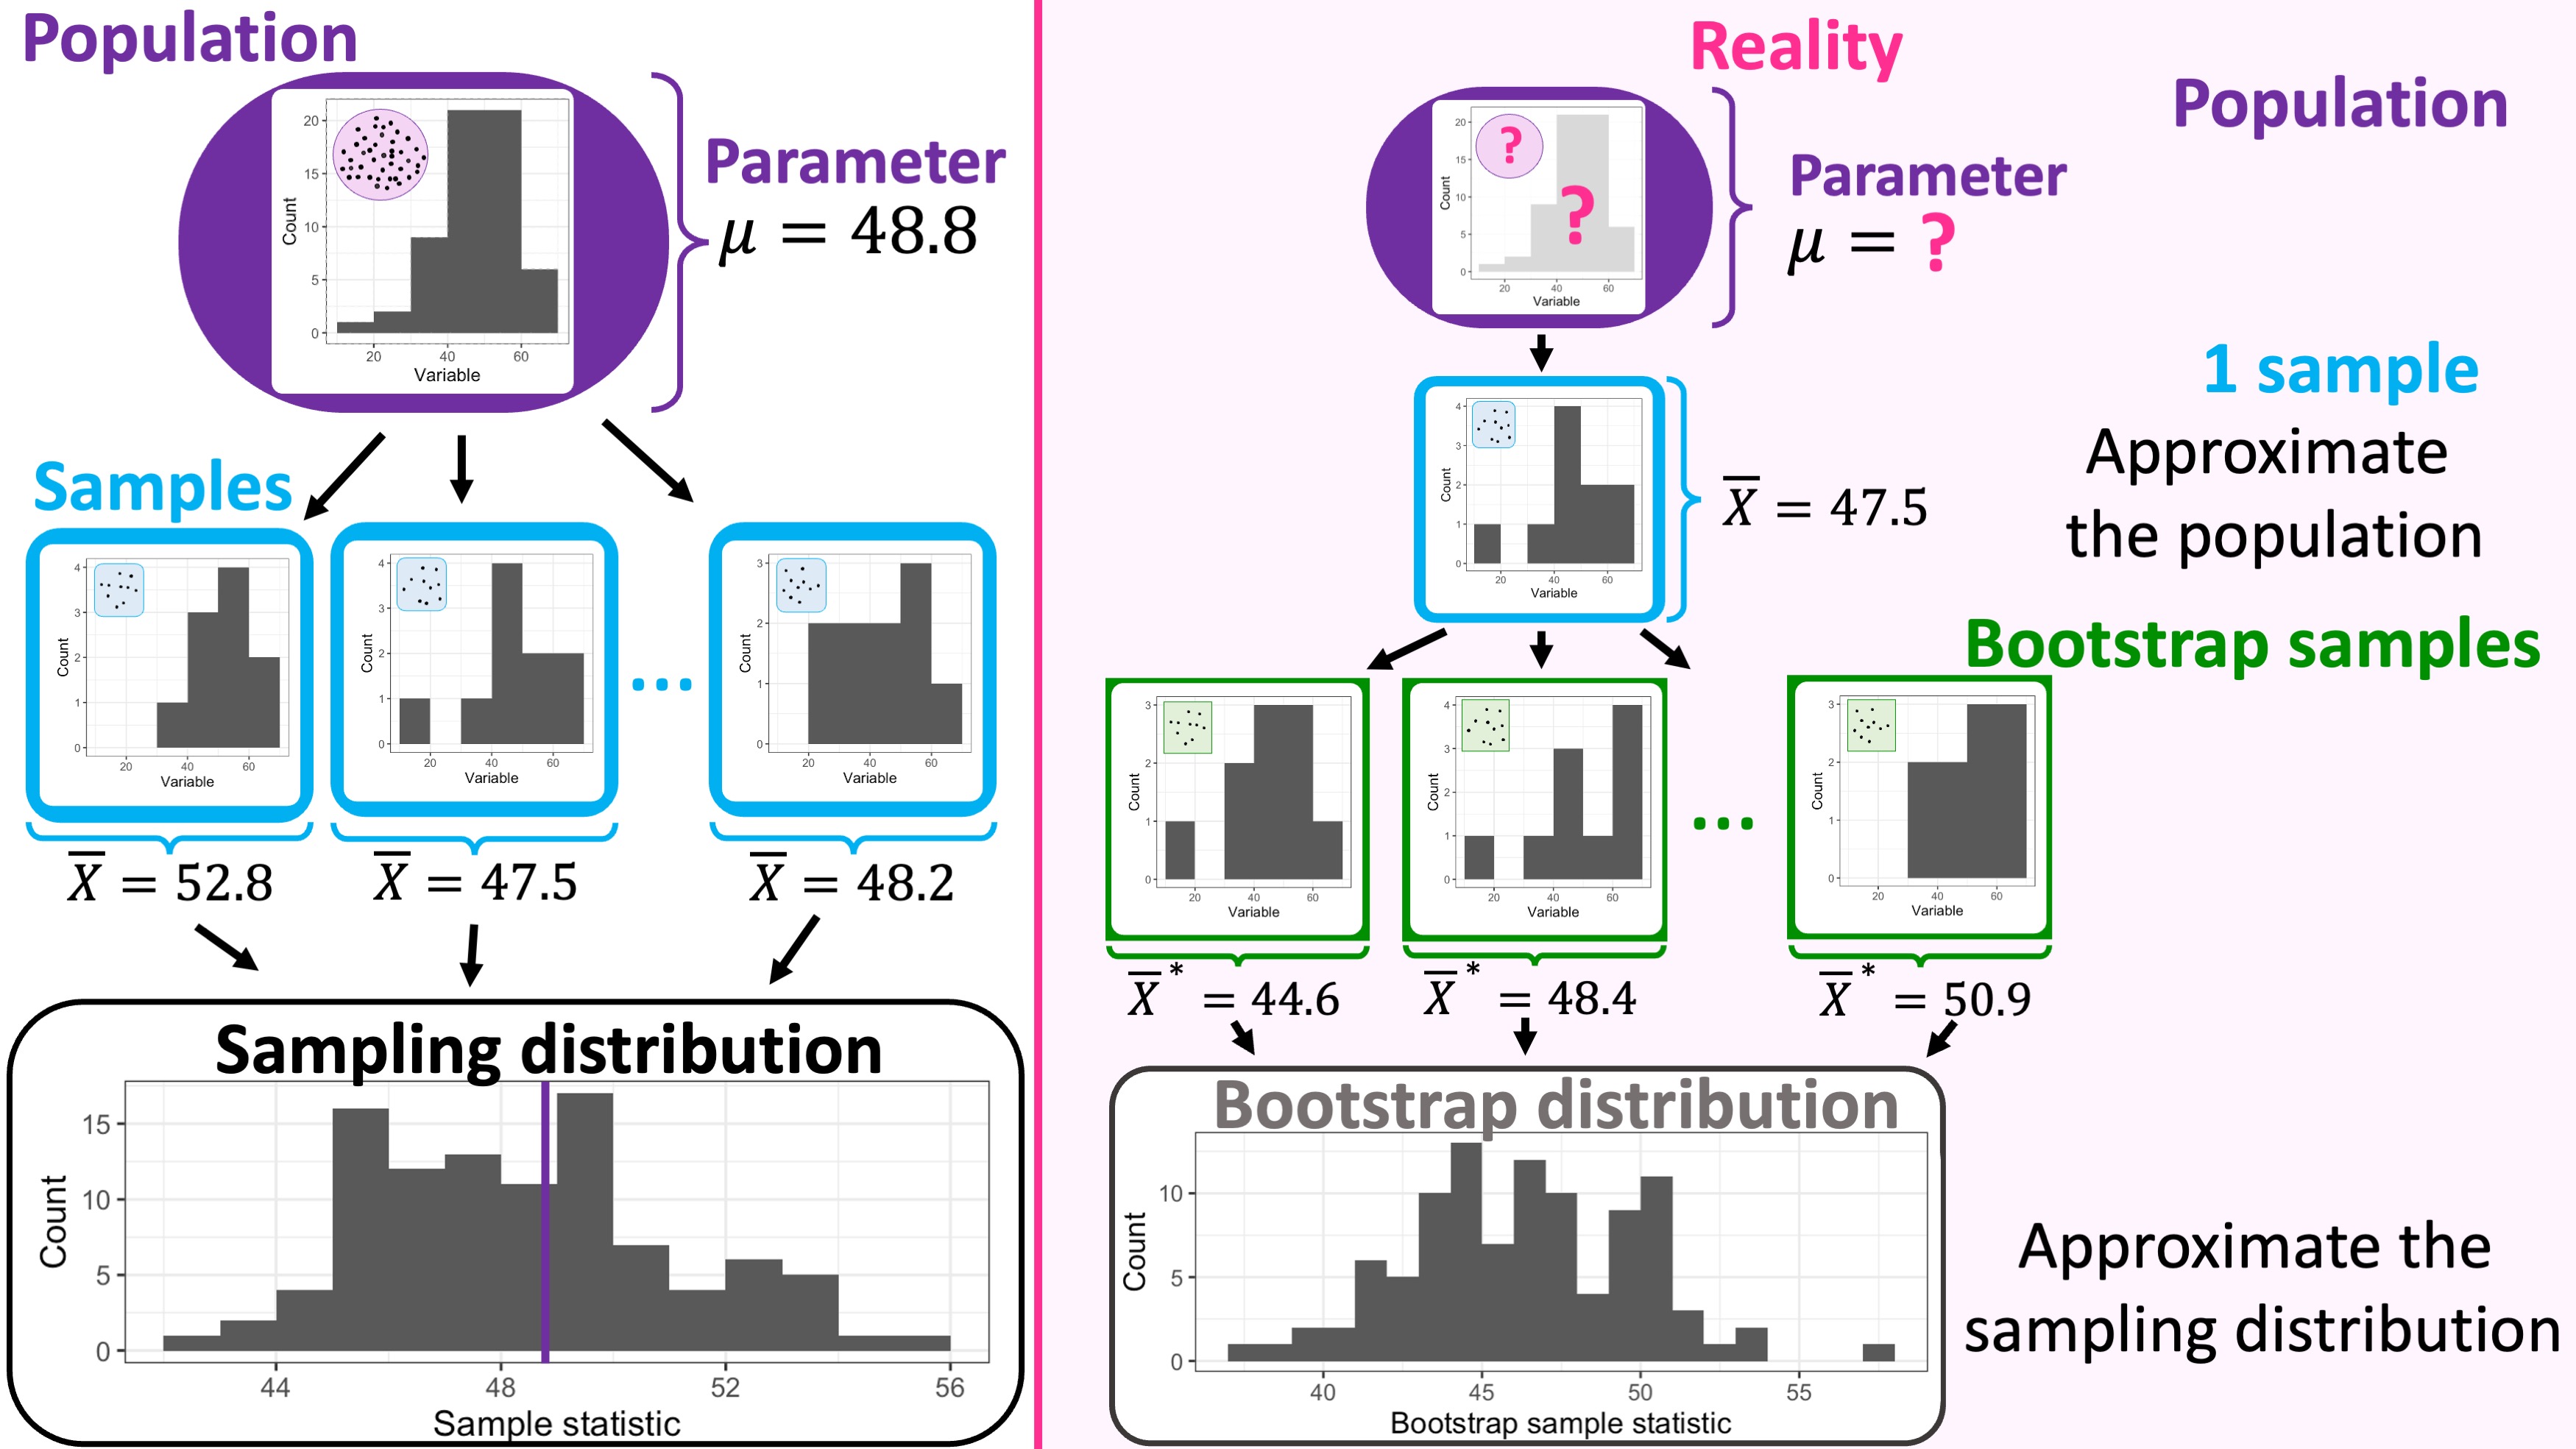
Estimating the sampling distribution with bootstrapping
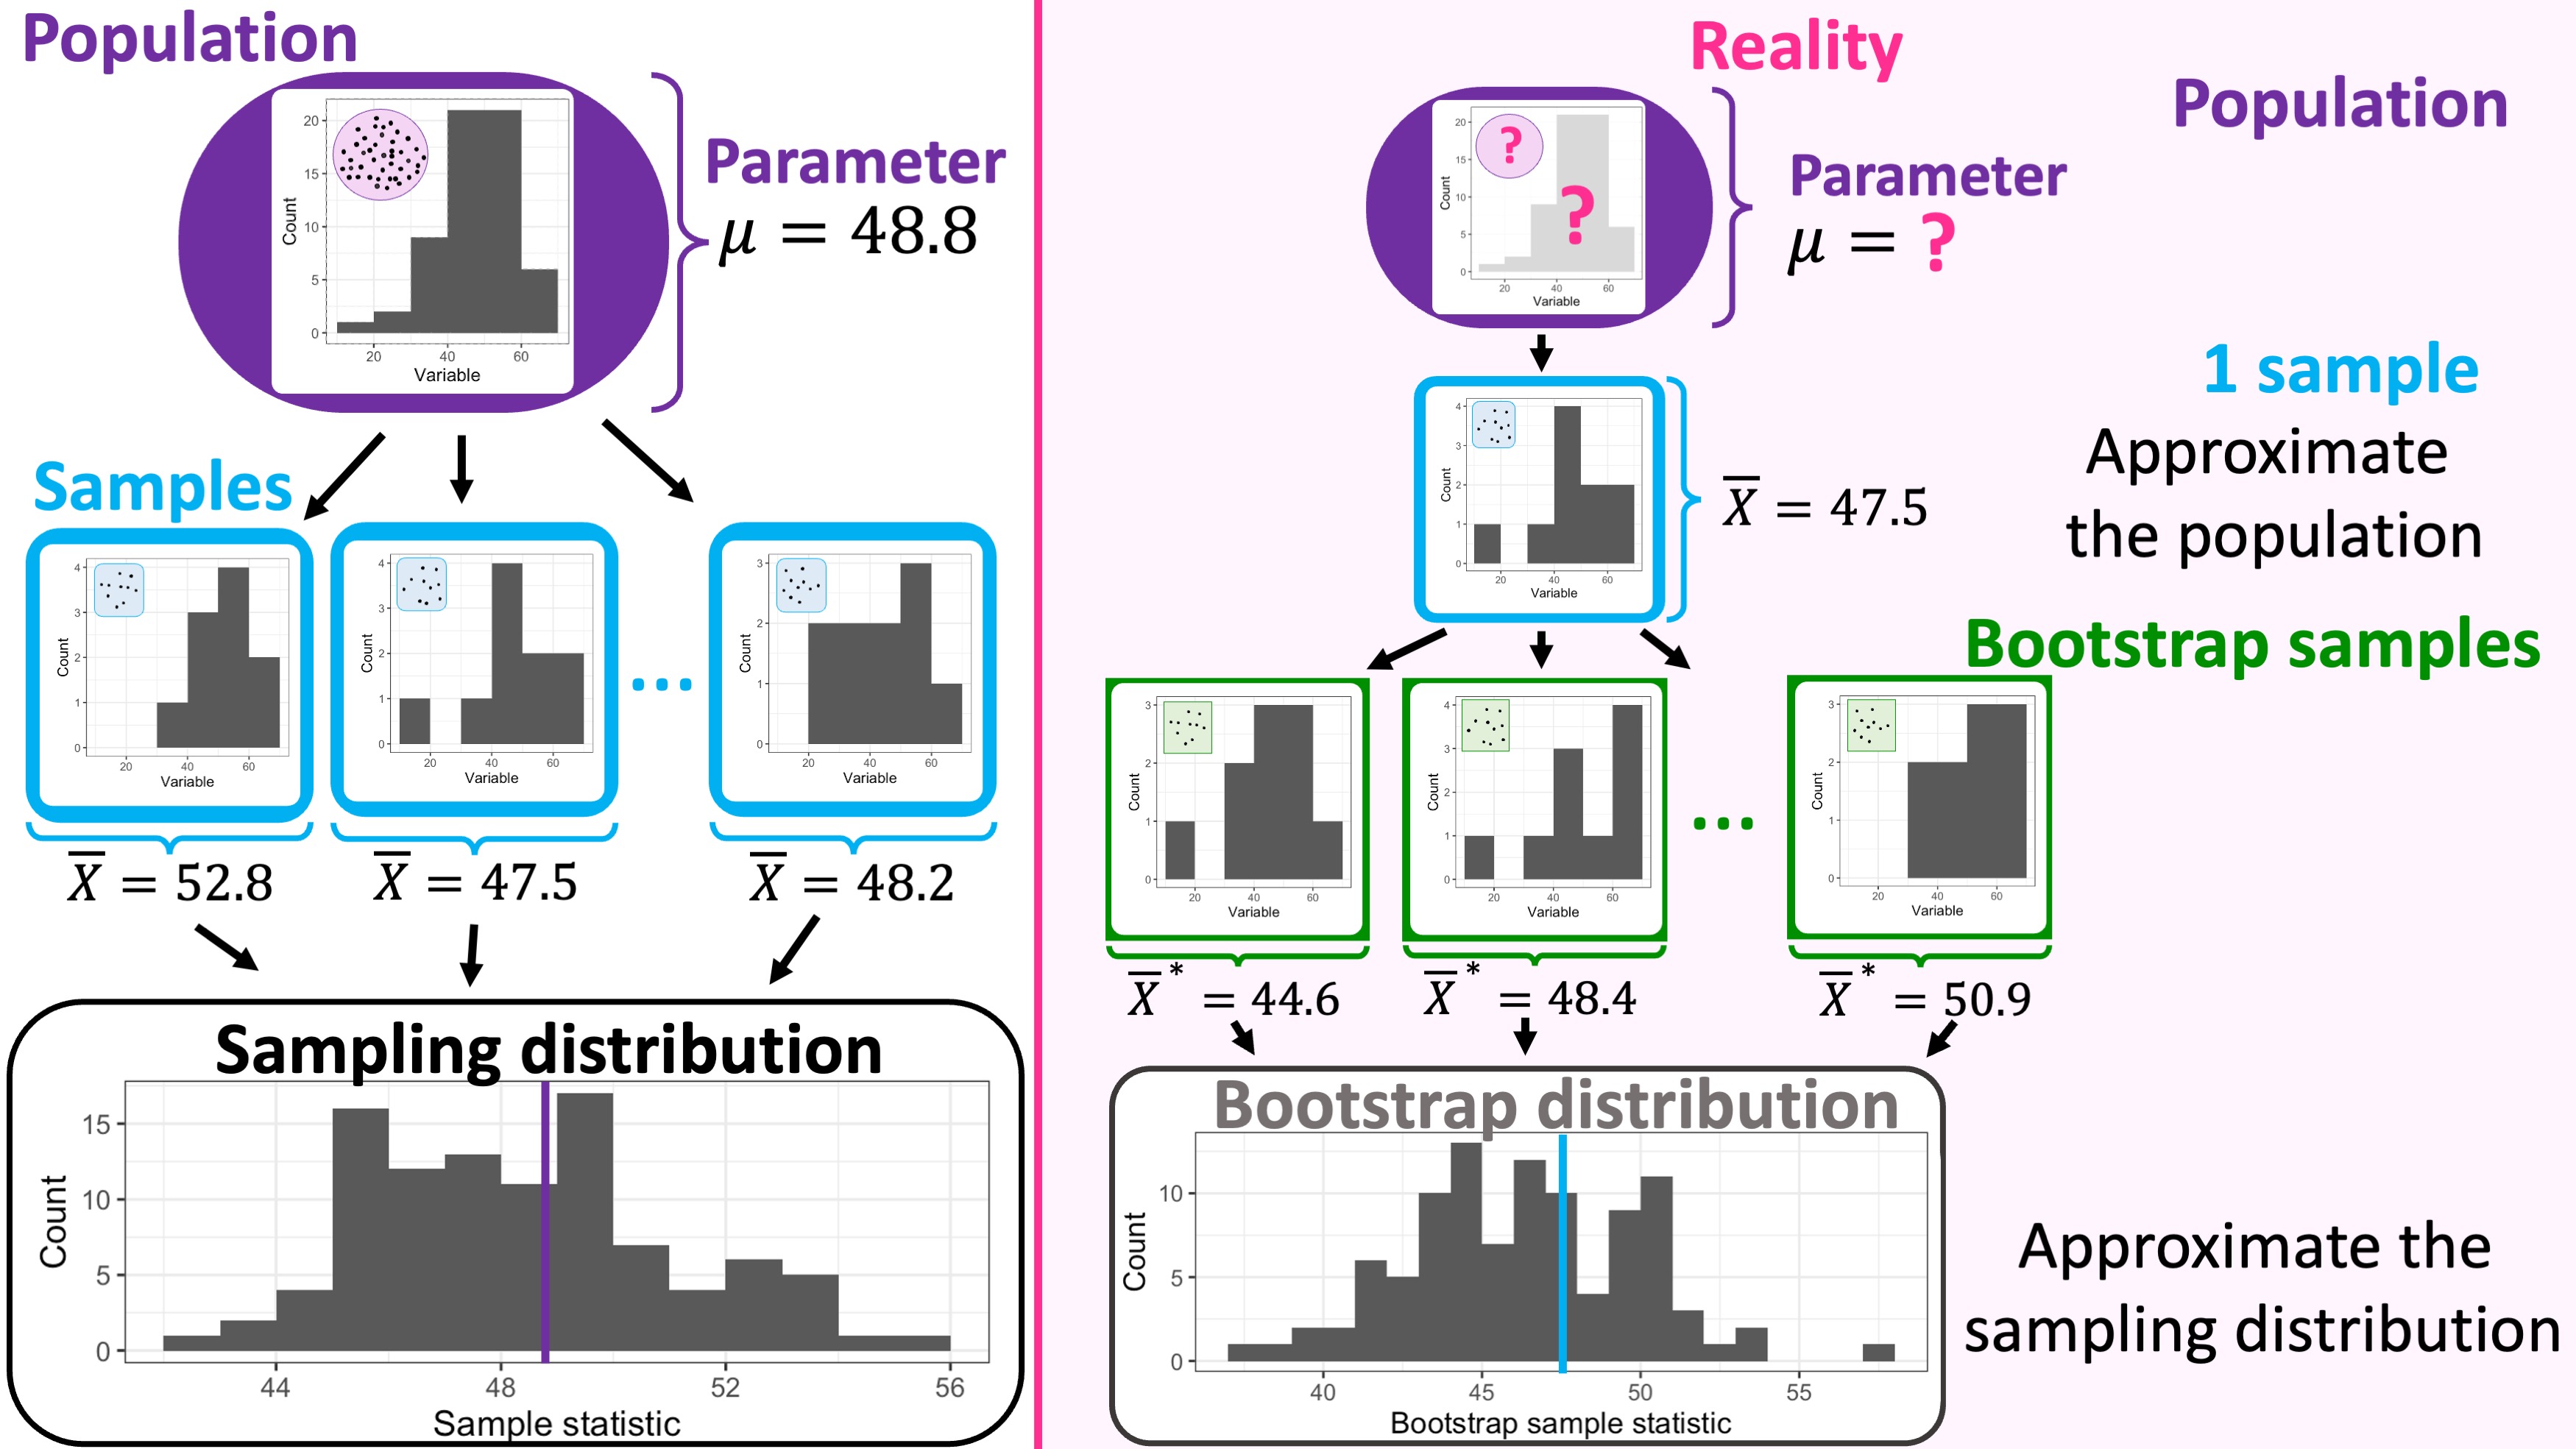
Important: Bootstrapping
- Bootstrapping samples must be:
- drawn with replacement;
- of the same size as the original sample;
- The boostrap distribution:
- is an approximation of the sampling distribution (has similar spread and shape);
- is centered around the sample statistic (not the parameter);
- used to estimate the standard error of a statistic;
Take home
- Concepts:
- Bootstrap distribution estimate the sampling distribution
- Sampling distribution centers around the population parameter
- Bootstrap distribution centers around the sample mean
- Even though the centers of bootstrap distribution and sampling distribution differ, the bootstrap standard error is a good estimate of the sampling standard error
- Use:
- Bootstrapping can be used with many sample statistics (means, proportions, median, percentile)
- If the sample is not representative, the boostrap distribution will be biased
- Does not work well when the original sample size is small
Today’s worksheet
- Introduce bootstrapping
- Compare the bootstrap distribution with the sample and sampling distributions
© 2024 Rodolfo Lourenzutti, Melissa Lee & Marie Auger-Méthé – Material Licensed under CC By-SA 4.0
Comments on Sampling distribution