Sampling Techniques
STAT 200 - Chapter 9


Population Concepts
emojis = ["female-nurse1", "female-nurse2", "female-nurse3", "male-nurse1",
  "male-nurse2", "female-doc1","female-doc2", "female-doc3", "male-doc1",
  "male-doc2", "female-staff1", "female-staff2", "female-staff3", "male-staff1",
  "male-staff2", "male-staff3"];

// Loading the data
workers = await d3.json("https://ubc-stat.github.io/stat-200/data/workers_data.json");

//calculate the parameters
asc = arr => arr.sort((a, b) => a - b);
sum = arr => arr.reduce((a, b) => a + b, 0);
mean = arr => sum(arr) / arr.length;

/**
 * Computes the sample standard deviation of an array of numbers.
 *
 * @function
 * @param {number[]} arr - An array of numbers for which the sample standard deviation is to be calculated.
 * @returns {number} The sample standard deviation of the input array, rounded to two decimal places.
 *
 * @example
 * std([1, 2, 3, 4, 5]); // Returns 1.58
 * std([10, 20, 30, 40, 50]); // Returns 15.81
 */
std = (arr) => {
    const mu = mean(arr);
    const diffArr = arr.map(a => (a - mu) ** 2);
    return Math.sqrt(sum(diffArr) / (arr.length - 1));
};


/**
 * Computes the q-th quantile of a given array of numbers.
 *
 * @function
 * @param {number[]} arr - An array of numbers for which the quantile is to be calculated.
 * @param {number} q - The quantile to compute, where 0 <= q <= 1. For example, 0.25 represents the first quartile (25th percentile).
 * @returns {number} The calculated quantile value, rounded to two decimal places.
 *
 * @example
 * quantile([1, 2, 3, 4, 5], 0.25); // Returns 2
 * quantile([10, 20, 30, 40, 50], 0.5); // Returns 30
 */
quantile = (arr, q) => {
    const sorted = asc(arr);
    const pos = (sorted.length - 1) * q;
    const base = Math.floor(pos);
    const rest = pos - base;
    if (sorted[base + 1] !== undefined) {
        return sorted[base] + rest * (sorted[base + 1] - sorted[base]);
    } else {
        return sorted[base]
    }
};


pop_mean = mean(workers.map(d => d.income)).toFixed(2);
pop_sd = std(workers.map(d => d.income))
pop_25q = quantile(workers.map(d => d.income), 0.25)
pop_50q = quantile(workers.map(d => d.income), 0.50)
pop_75q = quantile(workers.map(d => d.income), 0.75)
pop_99q = quantile(workers.map(d => d.income), 0.99)


// Filtering data
worker_filtered = {
  const worker_filtered = {
    'female': {
       'nurse': workers.filter(worker => worker.sex == 'female' && worker.job == 'nurse'),
       'staff': workers.filter(worker => worker.sex == 'female' && worker.job == 'staff'),
      'doctor': workers.filter(worker => worker.sex == 'female' && worker.job == 'doctor')
    },
    'male': {
       'nurse': workers.filter(worker => worker.sex == 'male' && worker.job == 'nurse'),
       'staff': workers.filter(worker => worker.sex == 'male' && worker.job == 'staff'),
      'doctor': workers.filter(worker => worker.sex == 'male' && worker.job == 'doctor')
    }
  }

  return worker_filtered;
}


/**
 * Generates a random number from a uniform distribution within a specified range [min, max).
 *
 * @function
 * @param {number} min - The lower bound of the range.
 * @param {number} max - The upper bound of the range.
 * @returns {number} A random number from a uniform distribution within the range [min, max).
 *
 * @example
 * getRandom(1, 5); // Returns a random number between 1 (inclusive) and 5 (exclusive)
 * getRandom(10, 20); // Returns a random number between 10 (inclusive) and 20 (exclusive)
 */
function getRandom(min, max) {
    return Math.random() * (max - min) + min;
}


/**
 * Randomly selects an element from a given array.
 *
 * @function
 * @param {Array} elements - An array of elements from which to select.
 * @returns {*} A randomly selected element from the input array.
 *
 * @example
 * getRandomElement([1, 2, 3, 4, 5]); // Returns one of the numbers from the array
 * getRandomElement(['apple', 'banana', 'cherry']); // Returns one of the strings from the array
 */
function getRandomElement(elements) {
    return elements[Math.floor(getRandom(0, elements.length))];
}


/**
 * Extracts the sex and job information from a given emoji name.
 *
 * @param {string} randomElement - The name of the emoji from which to extract the sex and job information.
 * @returns {string[]} - An array containing the extracted sex ('male' or 'female') and job ('nurse', 'doctor', or 'staff') information.
 *
 * @example
 *
 * extract_sex_job("female_nurse_emoji"); // Outputs: ['female', 'nurse']
 */
function extract_sex_job(randomElement){
  // The ternary operator checks if "female" is included in the name, assigning 'female' to sex if true, and 'male' if false.
  const sex = randomElement.includes("female") ? 'female': 'male';

  let job;
  if (randomElement.includes("nurse")){
    job = 'nurse';
  } else if (randomElement.includes("doc")){
    job = 'doctor'
  } else if (randomElement.includes("staff")){
    job = 'staff'
  }

  // Return the extracted information as an array with two elements: sex and job.
  return [sex, job];
}

console.log(pop_mean);
Population
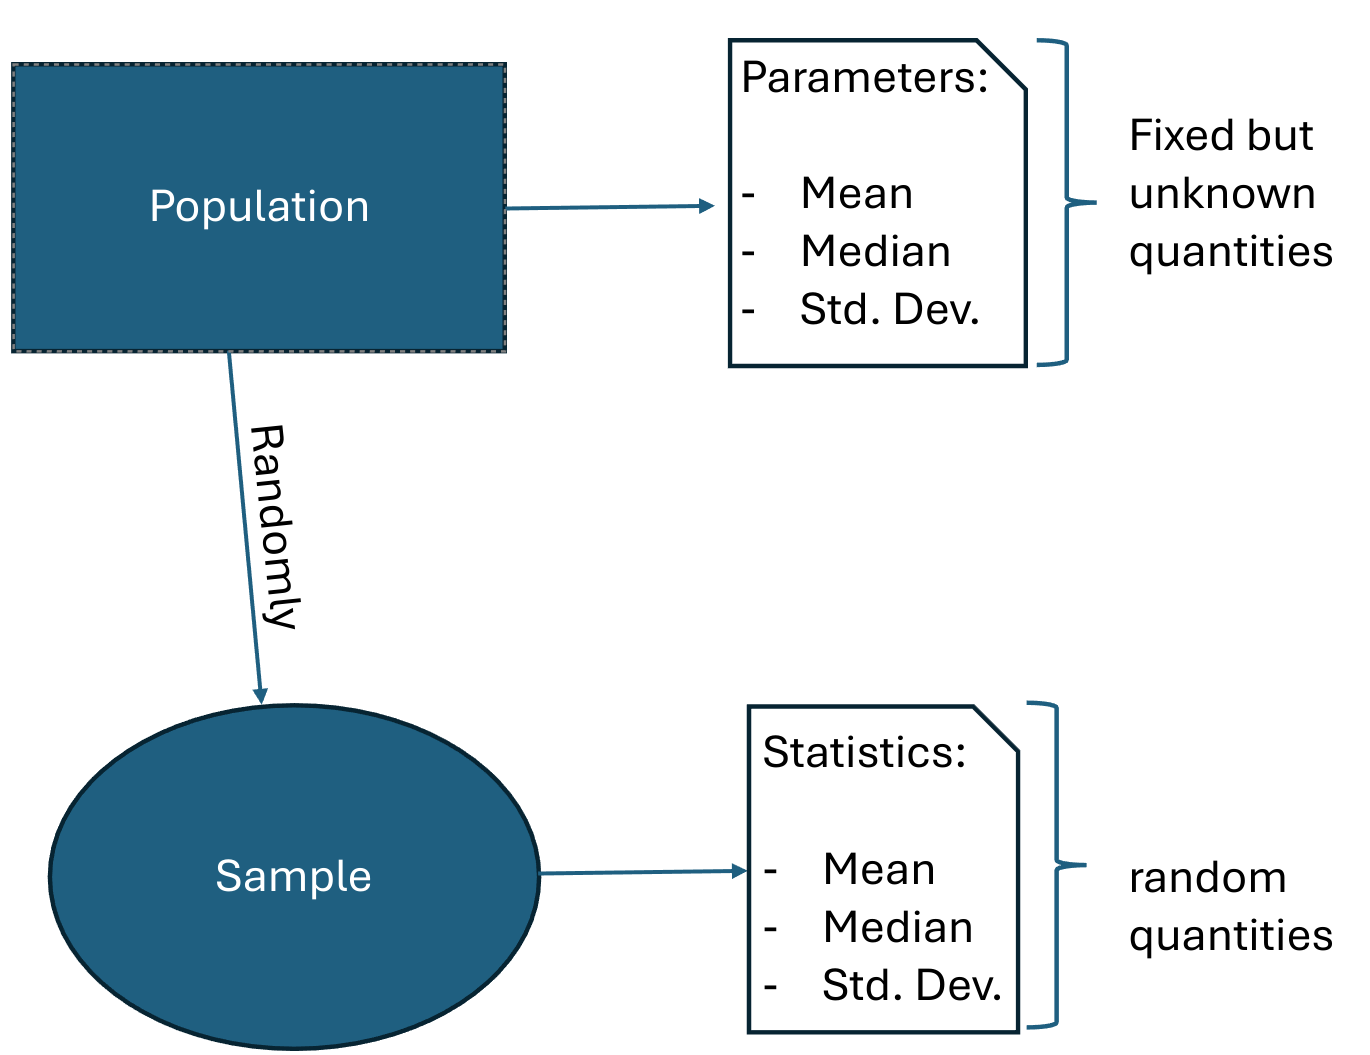
- Population: the group containing all elements you want to study.
- The population is fixed;
- You don’t have access to all elements of the population;
- Examples:
- All penguins in the world;
- All Adelie penguins in the world;
- All iPhones;
- All Google’s employees;
Parameters
- Parameters: quantities that summarize the population.
- Parameters are fixed but unknown;
- We want to estimate them because they give us useful information about the population;
- Examples:
- The average body mass of all penguins in the world;
- The median flipper length of all Adelie penguins in the world;
- The average lifetime of all iPhones 16 Pro Max;
- The IQR of all Google employees’ salaries;
Census
Scroll down
Retrieving data from the entire population is called census;
In a census, we have to measure all elements of the population.
- Unfortunately, this is often impossible, too costly (moneywise or timewise) or unethical.
Example 1: You want to learn the effectiveness of a new drug for HIV. Can you imagine infecting the entire population with HIV so we can give them an untested drug with unknown side effects?
- Example 2: Ford wants to crash-test its vehicles to measure some safety metrics. Should they test every single car they produce?
- What would they sell?
Parameters vs Variables
Scroll down
Caution
A common mistake many students make is to mix up a variable of interest with a parameter of interest.
A variable can be measured for each individual in the population;
Parameter is a summary of these measurements (e.g., mean, median, etc…)
- For example, one might be interested in the average dolphin weight, which is a parameter;
- the average weight is a quantity of the population, not of a single dolphin.
- However, the dolphin weight is what is being measured, i.e., the variable of interest.
Population distribution
The population distribution is obtained by measuring all the elements in the population.
The population distribution is unknown!
- remember: we don’t have access to all elements in the population, so we can never get the population distribution.
Sample Concepts
Sample
Scroll down
Sample: a subset (part) of the population;
- You do have access to all elements of the sample;
We hope that the sample represents well the population, but this is not always the case.
We use samples to obtain information about the population (i.e., to estimate parameters).
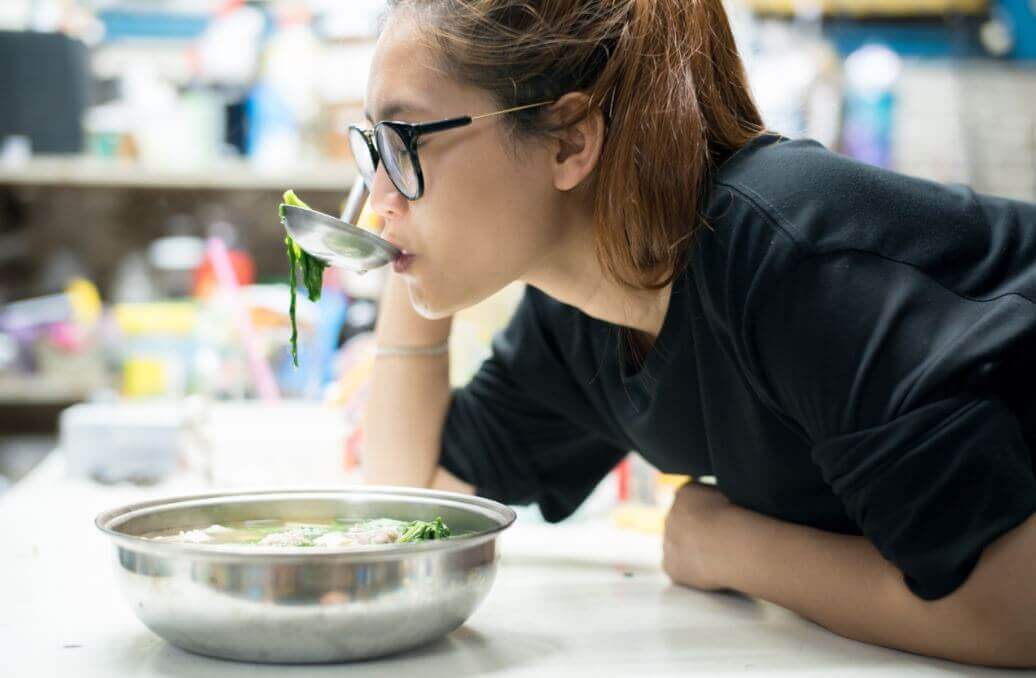
- Example 1: You’re making soup and want to know if it has enough salt. Then, you taste a spoonful (a sample!) of the soup. If that portion lacks salt, you conclude that the whole soup lacks salt.
- You are extrapolating results from a sample to the entire population.
- Example 2: Imagine you order a basket of french fries. You take one piece to see if you have put enough salt. But, just by chance, you ended with a piece that got too much salt on top of it. You might conclude wrongly that the whole basket of french fries is salty.
- In this case, you got a sample that doesn’t represent the population well. But it’s still a sample!

Random Samples
There are many different strategies we can use for sampling! We will cover some of them today.
But they all have one thing in common: they have a random component!
Randomness is crucial in sampling and statistical theory.
Randomization tends to give samples that are fairly representative of the population.
Sample Distribution
The sample distribution is obtained by measuring all the elements in the sample.
The sample distribution is known!
We hope that the sample distribution resembles the population distribution;
- remember: we don’t know the population distribution, so we will never know.
Statistics
Scroll down
- Statistics: quantities that summarize the sample.
- Samples are random, so statistics are also random;
- Statistics can be calculated because we can measure the entire sample;
- Statistics give information about the parameters;
- Statistics are the sample counterpart of parameters;
Sampling Techniques
Example: BC’s Health System
- Suppose we want to know the average income of all workers that work in BC’s hospitals.
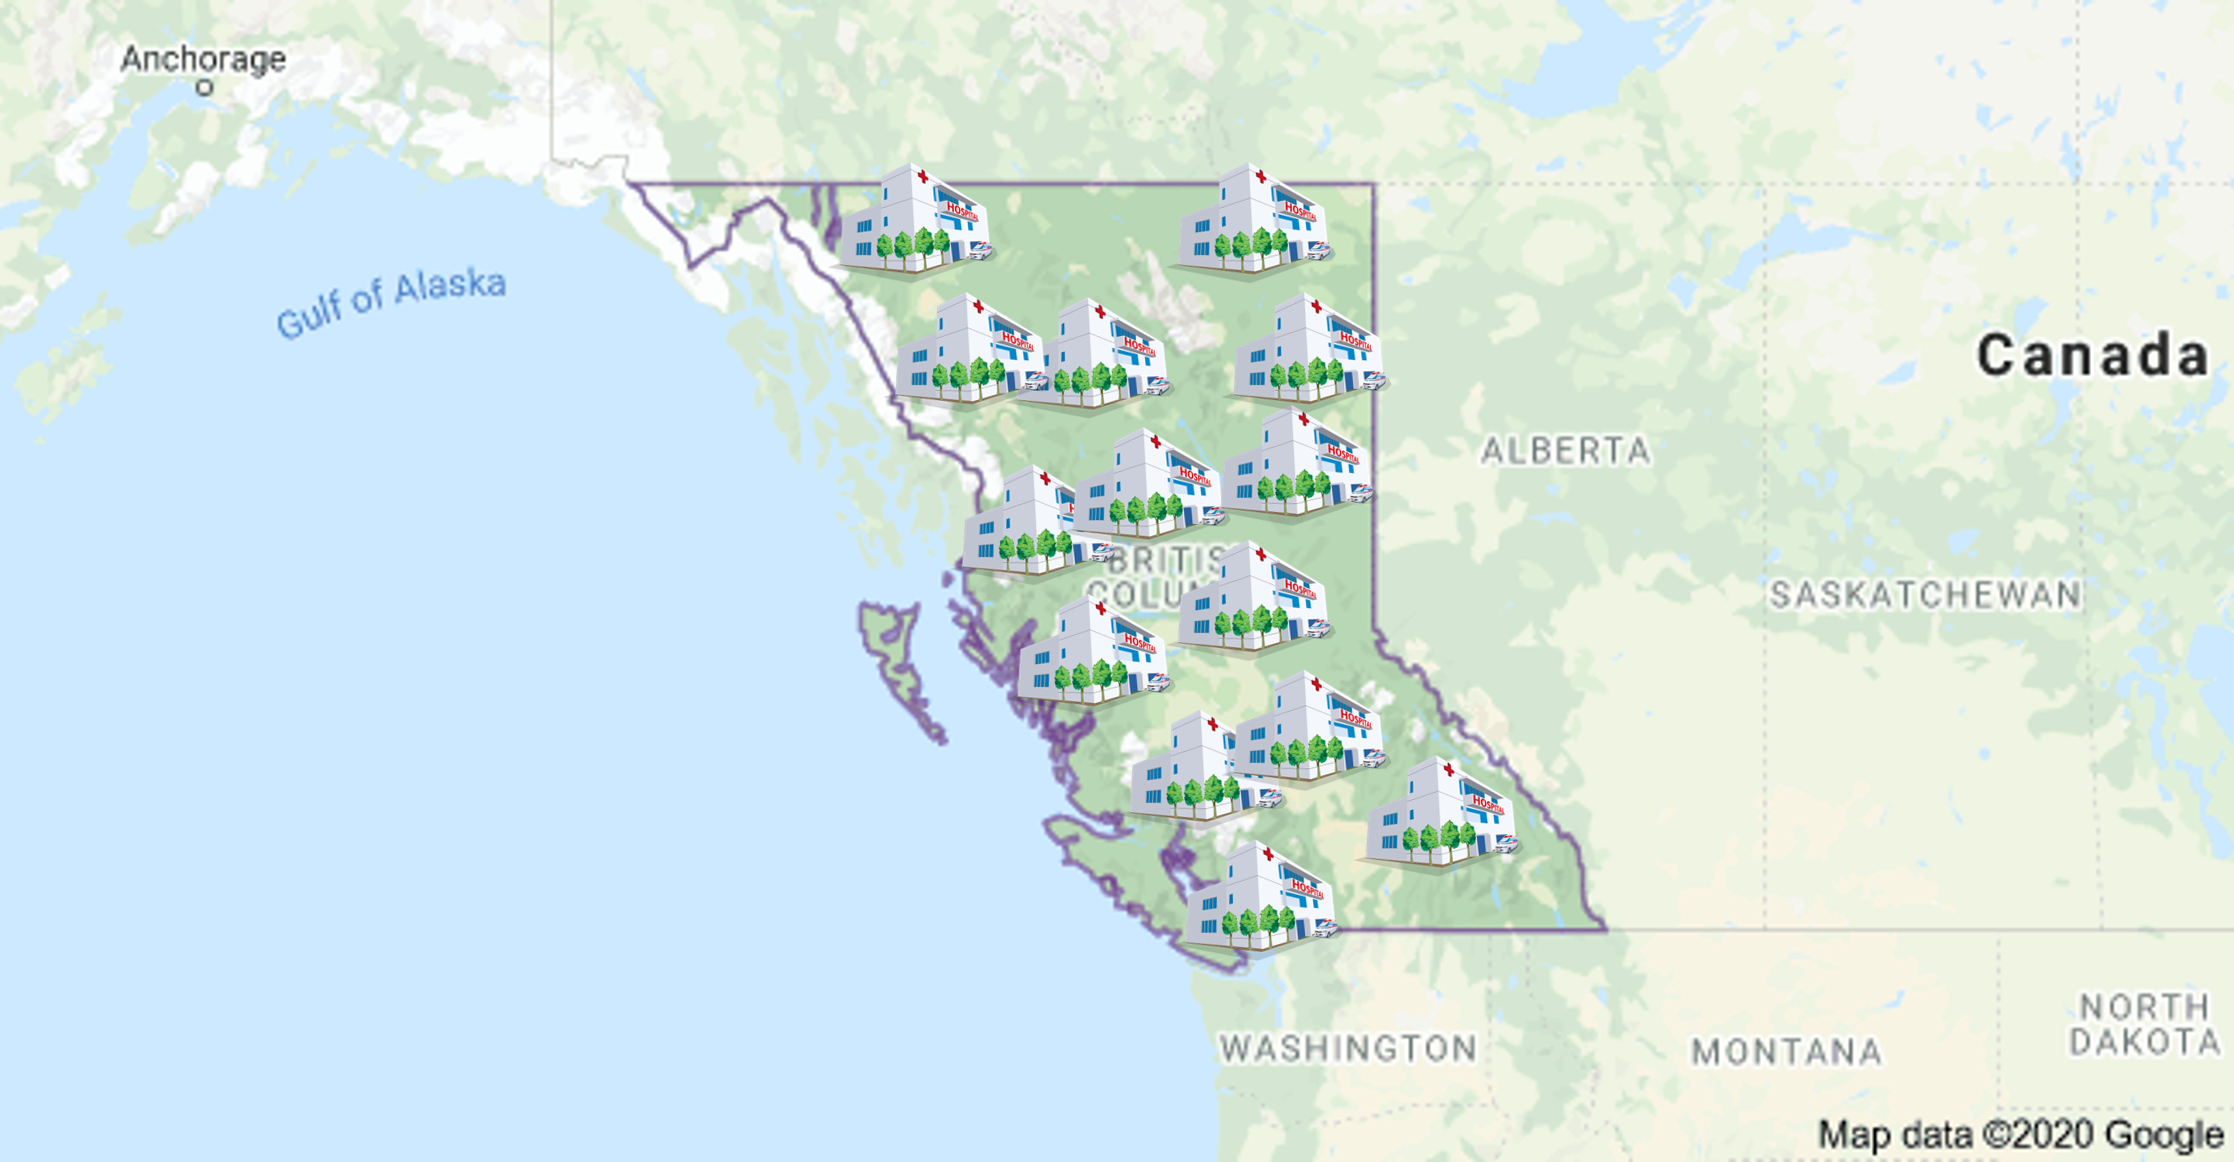
Example: BC’s Health System
- The first thing is to properly define our population;
- part time workers?
- temporary workers?
- casual workers?
Example: BC’s Health System
Second, the parameter(s) of interest.
What population quantities are you interested in?
- population mean income (\(\mu\))?
- population median income (\(Q_2\))?
- population Std. Dev. (\(\sigma\))?
- Finally, how to select our sample?
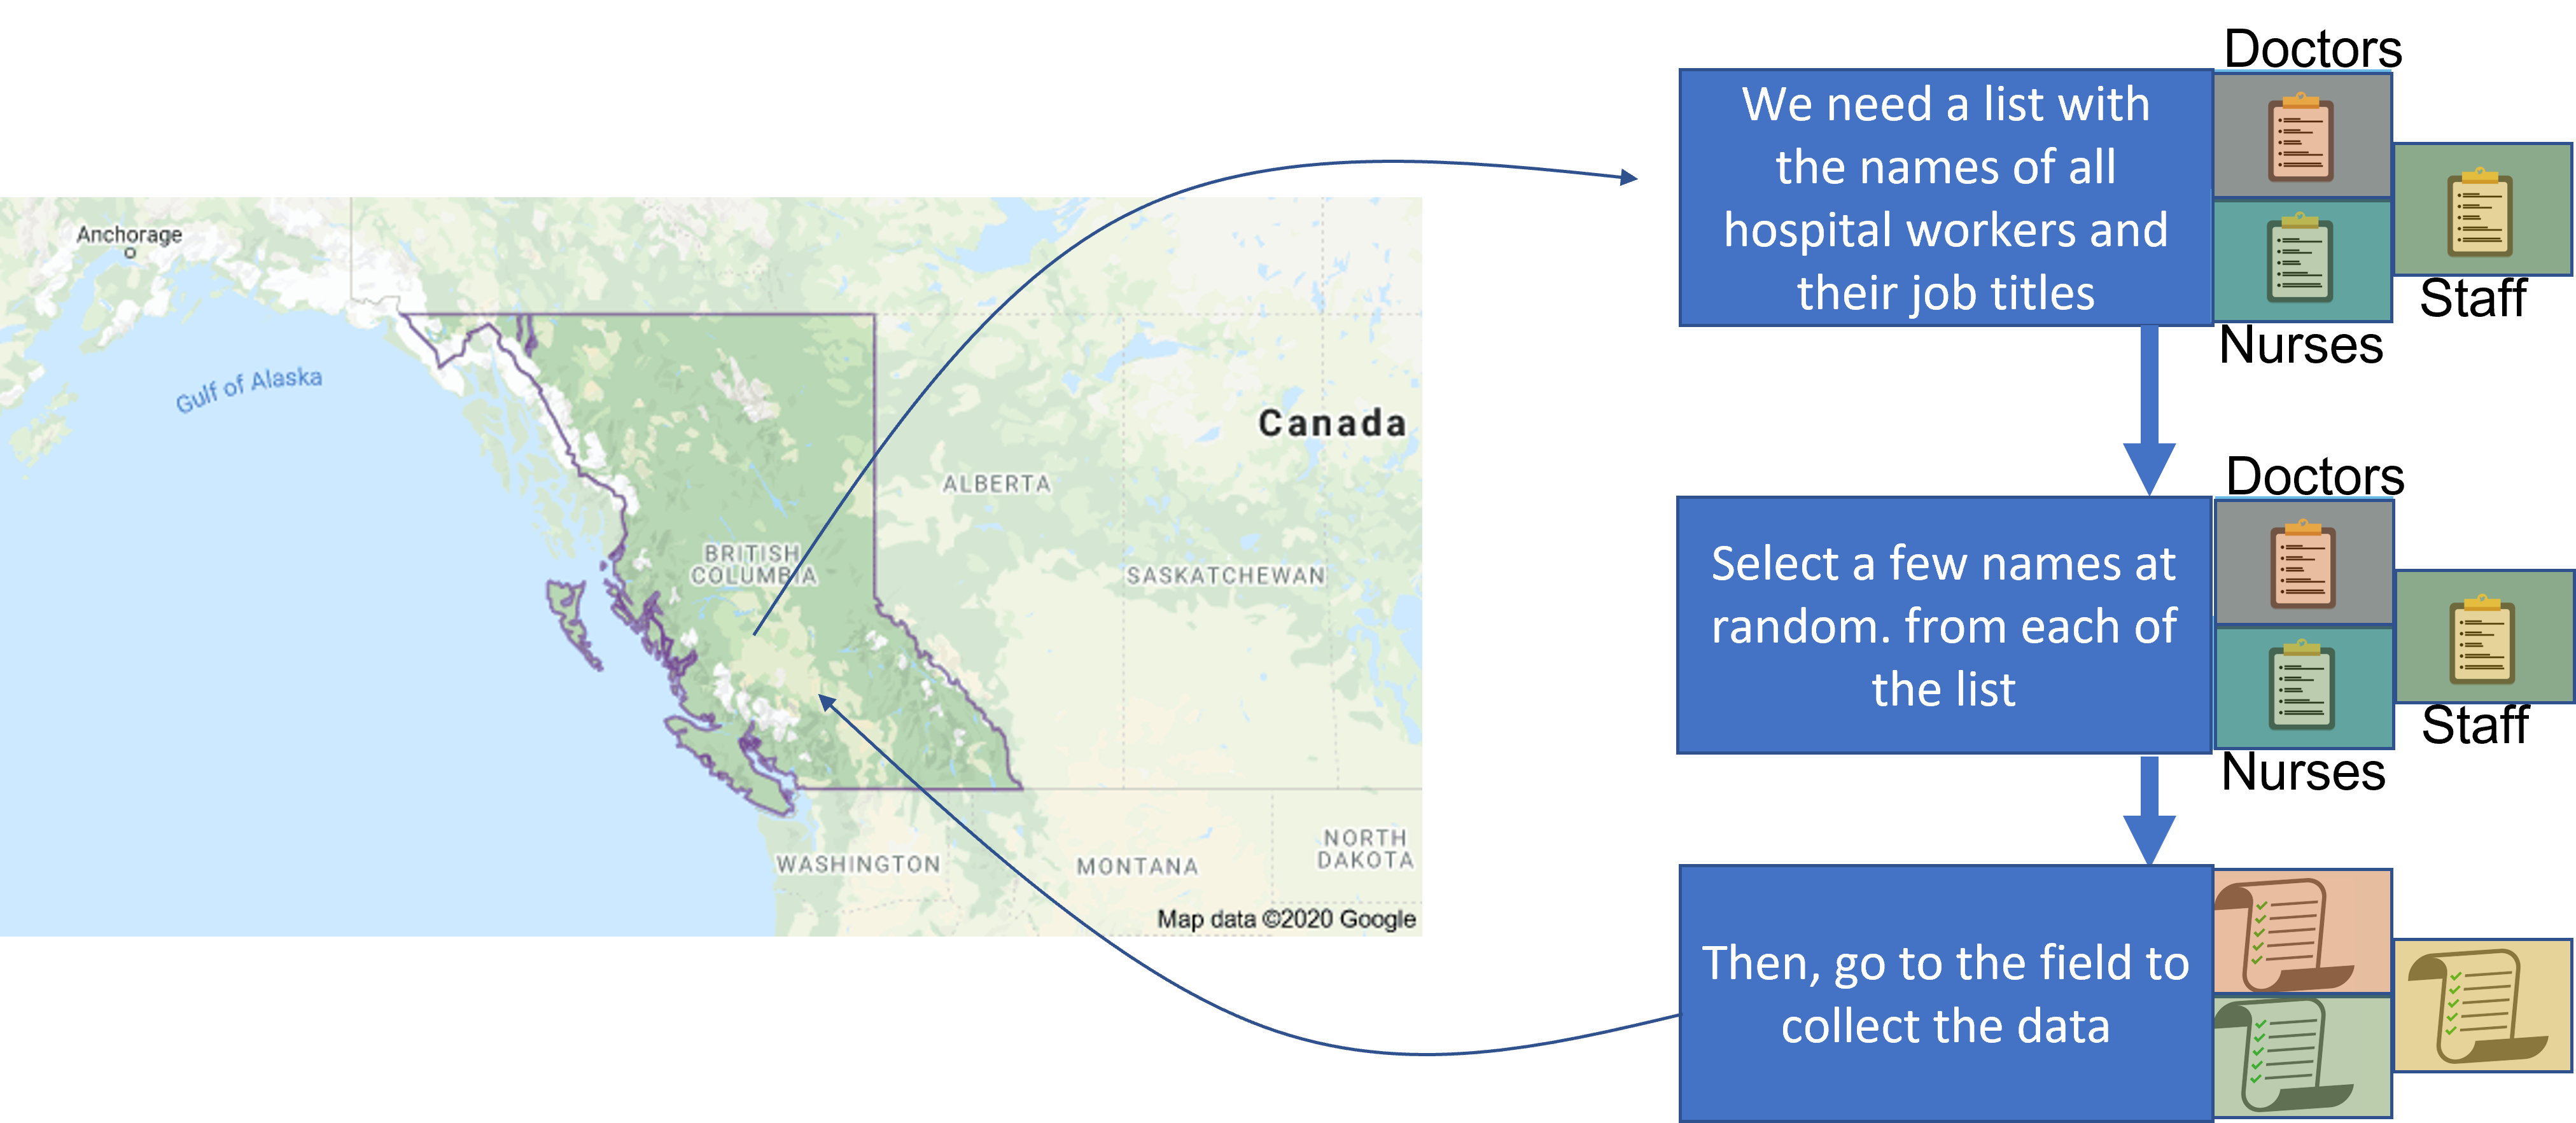
Simple Random Sampling (SRS)
- In SRS, all individuals have the same chance of being selected;
- The steps are:
- obtain the list with the names of all hospital workers (sampling frame);
- select a few names from the list at random;
- go to the field and collect the data;
Simple Random Sampling (SRS)
Simple Random Sampling (SRS)
You might need to refresh this page to show the plot
Population (\(\mu = ?\))
{
  // This code append the images to the population container.
  const N = 750; // how many images to append
  const div = document.querySelector("#pop-srs1");
  //div.style.height=`${0.10*screen.height}px`;

  for (let i=0; i < N; i++){
     let randomElement = getRandomElement(emojis);
     let img = html`<img src="imgs/${randomElement}.svg" height="45px" width=auto style='position: absolute; left: ${getRandom(0, 90)}%; top: ${getRandom(0, 82)}%; padding:0; margin:0;'></img>`;
     div.append(img);
  }
}{
// Creates the SRS Population Histogram
var margin = {top: 10, right: 10, bottom: 30, left: 25},
width = document.querySelector("#pop-srs1").clientWidth - margin.left - margin.right,
height = 250 - margin.top - margin.bottom;
d3.select("#truth-container")
.append("p")
.text('Population distribution')
.style('font-size', '0.7em')
.style('margin', 0)
// append the svg object to the body of the page
var svg = d3.select("#truth-container")
.append("svg")
.attr("width", width + margin.left + margin.right)
.attr("height", height + margin.top + margin.bottom)
.append("g")
.attr("transform",
"translate(" + margin.left + "," + margin.top + ")");
// X axis: scale and draw:
var x = d3.scaleLinear()
.domain([d3.min(workers, d => d.income), d3.max(workers, d => d.income)])
.range([margin.left, width - margin.right]);
svg.append("g")
.attr("transform", "translate(0," + `${height - margin.bottom}` + ")")
.call(d3.axisBottom(x).tickSizeOuter(0))
.call(g => g.append("text")
.attr("x", width / 2)
.attr("fill", "currentColor")
.attr("font-weight", "bold")
.attr("text-anchor", "bottom")
.attr('font-size', '16px')
.attr("class", "axis")
.attr("dy", "2.5em")
.text("Income (in thousands of $)")
.attr("class","axes-label"));
// set the parameters for the histogram
var histogram = d3.histogram()
.value(d => d.income) // I need to give the vector of value
.domain(x.domain()) // then the domain of the graphic
.thresholds(x.ticks(20)); // then the numbers of bins
// And apply this function to data to get the bins
var bins = histogram(workers);
// Y axis: scale and draw:
var y = d3.scaleLinear()
.range([height - margin.bottom, 0])
.domain([0, d3.max(bins, d => d.length + 100)]); // d3.hist has to be called before the Y axis obviously
svg.append("g")
.attr("transform", `translate(${margin.left},0)`)
.call(d3.axisLeft(y))
.call(g => g.select(".tick:last-of-type text").clone()
.attr("x", -(height - margin.bottom)/2)
.attr("y", -40)
.attr("font-weight", "bold")
.attr('font-size', '16px')
.attr('transform', 'rotate(270)')
.attr("text-anchor", "middle")
.text("Frequency")
.attr("class","axes-label"));
// append the bar rectangles to the svg element
svg.selectAll("rect")
.data(bins)
.enter()
.append("rect")
.attr("x", 1)
.attr("transform", function(d) { return "translate(" + x(d.x0) + "," + y(d.length) + ")"; })
.attr("width", function(d) { return x(d.x1) - x(d.x0) -1 ; })
.attr("height", function(d) { return height - y(d.length) - margin.bottom; })
.style("fill", "steelblue")
d3.select("#truth-container")
.append("p")
.text('A few parameters:')
.style('font-size', '0.7em')
.style('margin', 0)
let ul = d3.select("#truth-container")
.append('ul')
.style('font-size', '0.5em');
ul.append('li')
.text(`Mean: ${pop_mean}`)
.attr("style", 'margin-bottom: 0 !important;');
ul.append('li')
.text(`Median: ${pop_50q}`)
.attr("style", 'margin-bottom: 0 !important;');
ul.append('li')
.text(`0.99-quantile: ${pop_99q}`)
.attr("style", 'margin-bottom: 0 !important;');
ul.append('li')
.text(`Std. Dev.: ${pop_sd}`)
.attr("style", 'margin-bottom: 0 !important;');
ul.append('li')
.text(`IQR: ${Math.round(100*(pop_75q-pop_25q))/100}`)
.attr("style", 'margin-bottom: 0 !important;');
}Sample
function append_sample_element(div, element, fontSize){
  let info_element = extract_sex_job(element);
  let worker = getRandomElement(worker_filtered[info_element[0]][info_element[1]]);
  let img = html`<img src="imgs/${element}.svg" height="45px" width="45px" data-income='${worker.income}' style='margin: 0 auto;'></img>`;

  const container = document.createElement("div");
  let name = html`<div style='margin-left: auto; margin-right:auto; font-size: ${fontSize};'>${worker.first_name}</div>`
  let income = html`<div style='margin-left: auto; margin-right:auto; font-size: ${fontSize};'>$${worker.income}k </div>`

  container.append(name);
  container.append(img);
  container.append(income);

  container.style.fontSize = '0.27em';
  container.style.display = 'flex'
  container.style.flexDirection = 'column';
  container.style.width = '60px';
  container.style.margin = '0';
  container.style.marginBottom = '1px';
  div.append(container);

  return worker;
}

function take_srs(size, div_selector){
  const div = document.querySelector(div_selector);
  div.innerHTML = '';

  let sample_elements = Array(size);
  for (let i=0; i < size; i++){

       let randomElement = getRandomElement(emojis);
       sample_elements[i] = append_sample_element(div, randomElement, '0.95em');
    }

  return sample_elements;
}

selected_elements_srs = take_srs(sample_size_srs1, "#sample-srs1");

srs_mean = Math.round(selected_elements_srs.reduce((partialSum, a) => partialSum + a.income, 0)/selected_elements_srs.length, 2);
{
let sample_size = sample_size_srs1;
// Creates the Histogram
var margin = {top: 10, right: 10, bottom: 30, left: 25},
width = document.querySelector("#pop-srs1").clientWidth - margin.left - margin.right,
height = 200 - margin.top - margin.bottom;
document.querySelector("#sample-dist-srs").innerHTML = '';
d3.select("#sample-dist-srs")
.append("p")
.text('Sample distribution')
.style('font-size', '0.7em')
.style('margin', 0);
var svg = d3.select("#sample-dist-srs")
.append("svg")
.attr("width", width + margin.left + margin.right)
.attr("height", height + margin.top + margin.bottom)
.append("g")
.attr("transform",
"translate(" + margin.left + "," + margin.top + ")");
// X axis: scale and draw:
var x = d3.scaleLinear()
.domain([d3.min(selected_elements_srs, d => d.income-10), d3.max(selected_elements_srs, d => d.income+10)])
.range([margin.left, width - margin.right]);
svg.append("g")
.attr("transform", "translate(0," + `${height - margin.bottom}` + ")")
.call(d3.axisBottom(x).tickSizeOuter(0))
.call(g => g.append("text")
.attr("x", width / 2)
.attr("fill", "currentColor")
.attr("font-weight", "bold")
.attr("text-anchor", "bottom")
.attr('font-size', '16px')
.attr("class", "axis")
.attr("dy", "2.5em")
.text("Income (in thousands of $)")
.attr("class","axes-label"));
// set the parameters for the histogram
var histogram = d3.histogram()
.value(d => d.income) // I need to give the vector of value
.domain(x.domain()) // then the domain of the graphic
.thresholds(x.ticks(20)); // then the numbers of bins
// And apply this function to data to get the bins
var bins = histogram(selected_elements_srs);
// Y axis: scale and draw:
var y = d3.scaleLinear()
.range([height - margin.bottom, 0])
.domain([0, d3.max(bins, d => d.length+10)]); // d3.hist has to be called before the Y axis obviously
svg.append("g")
.attr("transform", `translate(${margin.left},0)`)
.call(d3.axisLeft(y))
.call(g => g.select(".tick:last-of-type text").clone()
.attr("x", -(height - margin.bottom)/2)
.attr("y", -40)
.attr("font-weight", "bold")
.attr('font-size', '16px')
.attr('transform', 'rotate(270)')
.attr("text-anchor", "middle")
.text("Frequency")
.attr("class","axes-label"));
// append the bar rectangles to the svg element
svg.selectAll("rect")
.data(bins)
.enter()
.append("rect")
.attr("x", 1)
.attr("transform", function(d) { return "translate(" + x(d.x0) + "," + y(d.length) + ")"; })
.attr("width", function(d) { return x(d.x1) - x(d.x0) -1 ; })
.attr("height", function(d) { return height - y(d.length) - margin.bottom; })
.style("fill", "steelblue")
.on("mouseenter", (d, i, nodes) => {
// Mouse-over event: turns the bin red and add the number of data points in the bin to the top of the bin
d3.select(d.target).style("fill", "red");
d3.select(d.target.parentNode)
.append("text")
.attr("x", (x(i.x0) + x(i.x1)) / 2)
.attr("text-anchor", "middle")
.attr("y", y(i.length + 1))
.attr("class", "freq")
.attr('font-size', '0.5em')
.text(i.length)
.property("bar", d.target);
d3.select(d.target).style("cursor", "pointer"); // change the cursor
document.getElementById("sample-srs1")
.querySelectorAll("img")
.forEach(entry => {
if (+entry.dataset.income >= d.target.__data__.x0 &&
+entry.dataset.income <= d.target.__data__.x1){
entry.parentNode.style.border = 'solid';
entry.parentNode.style.borderColor = 'red';
}
});
})
.on("mouseout", (d, i, nodes) => {
// Mouse-out event: returns to the original configuration
if (!d.target.flag) {
d3.select(d.target).style("fill", "steelblue")
d3.select(d.target).style("cursor", "default");
d3.selectAll(".freq")
.filter((e, j, texts) => {
return texts[j].bar === d.target;
}).remove();
document.getElementById("sample-srs1")
.querySelectorAll("img")
.forEach(entry => {
if (+entry.dataset.income >= d.target.__data__.x0 &&
+entry.dataset.income <= d.target.__data__.x1){
entry.parentNode.style.border = 'none';
}
});
}
})
d3.select("#sample-dist-srs")
.append("p")
.text('A few statistics:')
.style('font-size', '0.7em')
.style('margin', 0)
let srs_mean = mean(selected_elements_srs.map(d => d.income)).toFixed(2);
let srs_sd = std(selected_elements_srs.map(d => d.income)).toFixed(2);
let srs_25q = quantile(selected_elements_srs.map(d => d.income), 0.25).toFixed(2);
let srs_50q = quantile(selected_elements_srs.map(d => d.income), 0.50).toFixed(2);
let srs_75q = quantile(selected_elements_srs.map(d => d.income), 0.75).toFixed(2);
let srs_99q = quantile(selected_elements_srs.map(d => d.income), 0.99).toFixed(2);
let ul = d3.select("#sample-dist-srs").append('ul');
ul.append('li')
.text(`Mean: ${srs_mean}`)
.attr("style", 'margin-bottom: 0 !important;');
ul.append('li')
.text(`Median: ${srs_50q}`)
.attr("style", 'margin-bottom: 0 !important;');
ul.append('li')
.text(`0.99-quantile: ${srs_99q}`)
.attr("style", 'margin-bottom: 0 !important;');
ul.append('li')
.text(`Std. Dev.: ${srs_sd}`)
.attr("style", 'margin-bottom: 0 !important;');
ul.append('li')
.text(`IQR: ${Math.round((srs_75q - srs_25q) * 100) / 100}`)
.attr("style", 'margin-bottom: 0 !important;');
ul.style('font-size', '0.5em')
.style('margin', 0);
}Simple Random Sampling (SRS)
- Use the previous slides to investigate the following questions:
- What happens to the statistics when a new sample is taken?
- What happens to the parameters when a new sample is taken?
- Contrast the Sample Distribution with the Population Distribution for small and large sample sizes. What do you notice?
Stratified Sampling
We are investigating the income of hospital workers in BC;
The idea is to divide the population into groups, called
strata;- Individuals in the same
stratumare similar to each other (in terms of the variables being measured);
- Individuals in the same
Then, we draw a SRS from each
stratumseparately;
Stratified Sampling
- For example, we could split the population into
staff,nurse, anddoctors.- or use even more groups:
IT staff,Admin staff,licensed nurse,registered nurse,general doctor,specialist doctor,surgeons.
- or use even more groups:
- It is expected that the income within each
stratum(job category) to be somewhat similar;
Stratified Sampling
- In stratified sampling, we:
- split the population into subpopulations - called
strata. - draw a SRS from each stratum;
- estimate the parameters of interest of each stratum separately;
- combine the strata’s estimates to build an overall estimate;
- split the population into subpopulations - called
Stratified Random Sampling
Stratified Random Sampling
You might need to refresh this page to show the plot
Population
Nurses
Staffs
Doctors
{
  const div_staff = document.querySelector('#pop-stratified1').querySelector('#pop-str-staff1');
  const div_doctor = document.querySelector('#pop-stratified1').querySelector('#pop-str-doctor1');
  const div_nurse = document.querySelector('#pop-stratified1').querySelector('#pop-str-nurse1');
  div_staff.innerHTML = '';
  div_doctor.innerHTML = '';
  div_nurse.innerHTML = '';

  const N = 750
  for (let i=0; i < N; i++){
      let randomElement = getRandomElement(emojis);

      if (randomElement.includes('staff')){
        let img = html`<img src="imgs/${randomElement}.svg" height="45px" width=auto style='position: absolute; left: ${getRandom(0, 90)}%; top: ${getRandom(0, 35)}%; padding:0; margin:0;'></img>`;
        div_staff.append(img);
      }
      if (randomElement.includes('doc')){
        let img = html`<img src="imgs/${randomElement}.svg" height="45px" width=auto style='position: absolute; left: ${getRandom(0, 90)}%; top: ${getRandom(0, 35)}%; padding:0; margin:0;'></img>`;
        div_doctor.append(img);
      }
      if (randomElement.includes('nurse')){
        let img = html`<img src="imgs/${randomElement}.svg" height="45px" width=auto style='position: absolute; left: ${getRandom(0, 90)}%; top: ${getRandom(0, 35)}%; padding:0; margin:0;'></img>`;
        div_nurse.append(img);
      }
    }
}31b8e172-b470-440e-83d8-e6b185028602:dAB5AHAAZQA6AE8AQQBCAGwAQQBHAFkAQQBOAFEAQgBoAEEARABjAEEATgB3AEEAeQBBAEMAMABBAFoAQQBCAGsAQQBEAFkAQQBNAHcAQQB0AEEARABRAEEATgBnAEEAeQBBAEQASQBBAEwAUQBBADQAQQBEAFEAQQBZAGcAQgBtAEEAQwAwAEEAWQBRAEIAbQBBAEQARQBBAE8AUQBBADUAQQBEAFUAQQBZAFEAQQB4AEEARwBJAEEATQBnAEIAaQBBAEQAawBBAAoAcABvAHMAaQB0AGkAbwBuADoATQB3AEEAeABBAEQASQBBAE4AZwBBADAAQQBBAD0APQAKAHAAcgBlAGYAaQB4ADoACgBzAG8AdQByAGMAZQA6AFAAQQBCADAAQQBHAEUAQQBZAGcAQgBzAEEARwBVAEEASQBBAEIAcABBAEcAUQBBAFAAUQBBAG4AQQBIAEEAQQBiAHcAQgB3AEEAQwAwAEEAYwB3AEIAMABBAEgASQBBAEwAUQBCAHcAQQBHAEUAQQBjAGcAQgBoAEEARwAwAEEAWgBRAEIAMABBAEcAVQBBAGMAZwBCAHoAQQBDAGMAQQBJAEEAQgBqAEEARwB3AEEAWQBRAEIAegBBAEgATQBBAFAAUQBBAG4AQQBIAE0AQQBkAEEAQgB5AEEARwBFAEEAZABBAEIAcABBAEcAWQBBAGEAUQBCAGwAQQBHAFEAQQBMAFEAQgAwAEEARwBFAEEAWQBnAEIAcwBBAEcAVQBBAEoAdwBBAGcAQQBDAEEAQQBJAEEAQQBnAEEAQwBBAEEAYwB3AEIAMABBAEgAawBBAGIAQQBCAGwAQQBEADAAQQBKAHcAQgAyAEEARwBrAEEAYwB3AEIAcABBAEcASQBBAGEAUQBCAHMAQQBHAGsAQQBkAEEAQgA1AEEARABvAEEASQBBAEIAagBBAEcAOABBAGIAQQBCAHMAQQBHAEUAQQBjAEEAQgB6AEEARwBVAEEATwB3AEEAZwBBAEcAWQBBAGIAdwBCAHUAQQBIAFEAQQBMAFEAQgB6AEEARwBrAEEAZQBnAEIAbABBAEQAbwBBAEkAQQBBAHcAQQBDADQAQQBOAFEAQgBsAEEARwAwAEEATwB3AEEAbgBBAEQANABBAEMAZwBBADgAQQBIAFEAQQBhAEEAQgBsAEEARwBFAEEAWgBBAEEAKwBBAEEAbwBBAEkAQQBBAGcAQQBEAHcAQQBkAEEAQgB5AEEARAA0AEEAQwBnAEEAZwBBAEMAQQBBAEkAQQBBAGcAQQBEAHcAQQBkAEEAQgBvAEEARAA0AEEAVQBBAEIAaABBAEgASQBBAFkAUQBCAHQAQQBHAFUAQQBkAEEAQgBsAEEASABJAEEAUABBAEEAdgBBAEgAUQBBAGEAQQBBACsAQQBBAG8AQQBJAEEAQQBnAEEAQwBBAEEASQBBAEEAOABBAEgAUQBBAGEAQQBBACsAQQBGAE0AQQBkAEEAQgBoAEEARwBZAEEAWgBnAEEAOABBAEMAOABBAGQAQQBCAG8AQQBEADQAQQBDAGcAQQBnAEEAQwBBAEEASQBBAEEAZwBBAEQAdwBBAGQAQQBCAG8AQQBEADQAQQBUAGcAQgAxAEEASABJAEEAYwB3AEIAbABBAEQAdwBBAEwAdwBCADAAQQBHAGcAQQBQAGcAQQBLAEEAQwBBAEEASQBBAEEAZwBBAEMAQQBBAFAAQQBCADAAQQBHAGcAQQBQAGcAQgBFAEEARwA4AEEAWQB3AEIAMABBAEcAOABBAGMAZwBBADgAQQBDADgAQQBkAEEAQgBvAEEARAA0AEEAQwBnAEEAZwBBAEMAQQBBAEkAQQBBAGcAQQBEAHcAQQBkAEEAQgBvAEEARAA0AEEAVAB3AEIAMgBBAEcAVQBBAGMAZwBCAGgAQQBHAHcAQQBiAEEAQQA4AEEAQwA4AEEAZABBAEIAbwBBAEQANABBAEMAZwBBAGcAQQBDAEEAQQBQAEEAQQB2AEEASABRAEEAYwBnAEEAKwBBAEEAbwBBAFAAQQBBAHYAQQBIAFEAQQBhAEEAQgBsAEEARwBFAEEAWgBBAEEAKwBBAEEAbwBBAFAAQQBCADAAQQBHAEkAQQBiAHcAQgBrAEEASABrAEEAUABnAEEASwBBAEMAQQBBAEkAQQBBADgAQQBIAFEAQQBjAGcAQQBnAEEARwBrAEEAWgBBAEEAOQBBAEMASQBBAGMAQQBCAHYAQQBIAEEAQQBMAFEAQgB5AEEARwA4AEEAZAB3AEEAdABBAEcAMABBAFoAUQBCAGgAQQBHADQAQQBJAGcAQQArAEEAQQBvAEEASQBBAEEAZwBBAEMAQQBBAEkAQQBBADgAQQBIAFEAQQBaAEEAQQArAEEARQAwAEEAWgBRAEIAaABBAEcANABBAFAAQQBBAHYAQQBIAFEAQQBaAEEAQQArAEEAQQBvAEEASQBBAEEAZwBBAEMAQQBBAEkAQQBBADgAQQBIAFEAQQBaAEEAQQBnAEEARwBNAEEAYgBBAEIAaABBAEgATQBBAGMAdwBBADkAQQBDAEkAQQBjAHcAQgAwAEEARwBFAEEAWgBnAEIAbQBBAEMAMABBAFkAdwBCAGwAQQBHAHcAQQBiAEEAQQBpAEEARAA0AEEAUABBAEEAdgBBAEgAUQBBAFoAQQBBACsAQQBBAG8AQQBJAEEAQQBnAEEAQwBBAEEASQBBAEEAOABBAEgAUQBBAFoAQQBBAGcAQQBHAE0AQQBiAEEAQgBoAEEASABNAEEAYwB3AEEAOQBBAEMASQBBAGIAZwBCADEAQQBIAEkAQQBjAHcAQgBsAEEAQwAwAEEAWQB3AEIAbABBAEcAdwBBAGIAQQBBAGkAQQBEADQAQQBQAEEAQQB2AEEASABRAEEAWgBBAEEAKwBBAEEAbwBBAEkAQQBBAGcAQQBDAEEAQQBJAEEAQQA4AEEASABRAEEAWgBBAEEAZwBBAEcATQBBAGIAQQBCAGgAQQBIAE0AQQBjAHcAQQA5AEEAQwBJAEEAWgBBAEIAdgBBAEcATQBBAGQAQQBCAHYAQQBIAEkAQQBMAFEAQgBqAEEARwBVAEEAYgBBAEIAcwBBAEMASQBBAFAAZwBBADgAQQBDADgAQQBkAEEAQgBrAEEARAA0AEEAQwBnAEEAZwBBAEMAQQBBAEkAQQBBAGcAQQBEAHcAQQBkAEEAQgBrAEEAQwBBAEEAWQB3AEIAcwBBAEcARQBBAGMAdwBCAHoAQQBEADAAQQBJAGcAQgB2AEEASABZAEEAWgBRAEIAeQBBAEcARQBBAGIAQQBCAHMAQQBDADAAQQBZAHcAQgBsAEEARwB3AEEAYgBBAEEAaQBBAEQANABBAFAAQQBBAHYAQQBIAFEAQQBaAEEAQQArAEEAQQBvAEEASQBBAEEAZwBBAEQAdwBBAEwAdwBCADAAQQBIAEkAQQBQAGcAQQBLAEEAQwBBAEEASQBBAEEAOABBAEgAUQBBAGMAZwBBAGcAQQBHAGsAQQBaAEEAQQA5AEEAQwBJAEEAYwBBAEIAdgBBAEgAQQBBAEwAUQBCAHkAQQBHADgAQQBkAHcAQQB0AEEARwAwAEEAWgBRAEIAawBBAEcAawBBAFkAUQBCAHUAQQBDAEkAQQBQAGcAQQBLAEEAQwBBAEEASQBBAEEAZwBBAEMAQQBBAFAAQQBCADAAQQBHAFEAQQBQAGcAQgBOAEEARwBVAEEAWgBBAEIAcABBAEcARQBBAGIAZwBBADgAQQBDADgAQQBkAEEAQgBrAEEARAA0AEEAQwBnAEEAZwBBAEMAQQBBAEkAQQBBAGcAQQBEAHcAQQBkAEEAQgBrAEEAQwBBAEEAWQB3AEIAcwBBAEcARQBBAGMAdwBCAHoAQQBEADAAQQBJAGcAQgB6AEEASABRAEEAWQBRAEIAbQBBAEcAWQBBAEwAUQBCAGoAQQBHAFUAQQBiAEEAQgBzAEEAQwBJAEEAUABnAEEAOABBAEMAOABBAGQAQQBCAGsAQQBEADQAQQBDAGcAQQBnAEEAQwBBAEEASQBBAEEAZwBBAEQAdwBBAGQAQQBCAGsAQQBDAEEAQQBZAHcAQgBzAEEARwBFAEEAYwB3AEIAegBBAEQAMABBAEkAZwBCAHUAQQBIAFUAQQBjAGcAQgB6AEEARwBVAEEATABRAEIAagBBAEcAVQBBAGIAQQBCAHMAQQBDAEkAQQBQAGcAQQA4AEEAQwA4AEEAZABBAEIAawBBAEQANABBAEMAZwBBAGcAQQBDAEEAQQBJAEEAQQBnAEEARAB3AEEAZABBAEIAawBBAEMAQQBBAFkAdwBCAHMAQQBHAEUAQQBjAHcAQgB6AEEARAAwAEEASQBnAEIAawBBAEcAOABBAFkAdwBCADAAQQBHADgAQQBjAGcAQQB0AEEARwBNAEEAWgBRAEIAcwBBAEcAdwBBAEkAZwBBACsAQQBEAHcAQQBMAHcAQgAwAEEARwBRAEEAUABnAEEASwBBAEMAQQBBAEkAQQBBAGcAQQBDAEEAQQBQAEEAQgAwAEEARwBRAEEASQBBAEIAagBBAEcAdwBBAFkAUQBCAHoAQQBIAE0AQQBQAFEAQQBpAEEARwA4AEEAZABnAEIAbABBAEgASQBBAFkAUQBCAHMAQQBHAHcAQQBMAFEAQgBqAEEARwBVAEEAYgBBAEIAcwBBAEMASQBBAFAAZwBBADgAQQBDADgAQQBkAEEAQgBrAEEARAA0AEEAQwBnAEEAZwBBAEMAQQBBAFAAQQBBAHYAQQBIAFEAQQBjAGcAQQArAEEAQQBvAEEASQBBAEEAZwBBAEQAdwBBAGQAQQBCAHkAQQBDAEEAQQBhAFEAQgBrAEEARAAwAEEASQBnAEIAdwBBAEcAOABBAGMAQQBBAHQAQQBIAEkAQQBiAHcAQgAzAEEAQwAwAEEATwBRAEEANQBBAEgARQBBAGQAUQBCAGgAQQBHADQAQQBkAEEAQgBwAEEARwB3AEEAWgBRAEEAaQBBAEQANABBAEMAZwBBAGcAQQBDAEEAQQBJAEEAQQBnAEEARAB3AEEAZABBAEIAawBBAEQANABBAE0AQQBBAHUAQQBEAGsAQQBPAFEAQQB0AEEASABFAEEAZABRAEIAaABBAEcANABBAGQAQQBCAHAAQQBHAHcAQQBaAFEAQQA4AEEAQwA4AEEAZABBAEIAawBBAEQANABBAEMAZwBBAGcAQQBDAEEAQQBJAEEAQQBnAEEARAB3AEEAZABBAEIAawBBAEMAQQBBAFkAdwBCAHMAQQBHAEUAQQBjAHcAQgB6AEEARAAwAEEASQBnAEIAegBBAEgAUQBBAFkAUQBCAG0AQQBHAFkAQQBMAFEAQgBqAEEARwBVAEEAYgBBAEIAcwBBAEMASQBBAFAAZwBBADgAQQBDADgAQQBkAEEAQgBrAEEARAA0AEEAQwBnAEEAZwBBAEMAQQBBAEkAQQBBAGcAQQBEAHcAQQBkAEEAQgBrAEEAQwBBAEEAWQB3AEIAcwBBAEcARQBBAGMAdwBCAHoAQQBEADAAQQBJAGcAQgB1AEEASABVAEEAYwBnAEIAegBBAEcAVQBBAEwAUQBCAGoAQQBHAFUAQQBiAEEAQgBzAEEAQwBJAEEAUABnAEEAOABBAEMAOABBAGQAQQBCAGsAQQBEADQAQQBDAGcAQQBnAEEAQwBBAEEASQBBAEEAZwBBAEQAdwBBAGQAQQBCAGsAQQBDAEEAQQBZAHcAQgBzAEEARwBFAEEAYwB3AEIAegBBAEQAMABBAEkAZwBCAGsAQQBHADgAQQBZAHcAQgAwAEEARwA4AEEAYwBnAEEAdABBAEcATQBBAFoAUQBCAHMAQQBHAHcAQQBJAGcAQQArAEEARAB3AEEATAB3AEIAMABBAEcAUQBBAFAAZwBBAEsAQQBDAEEAQQBJAEEAQQBnAEEAQwBBAEEAUABBAEIAMABBAEcAUQBBAEkAQQBCAGoAQQBHAHcAQQBZAFEAQgB6AEEASABNAEEAUABRAEEAaQBBAEcAOABBAGQAZwBCAGwAQQBIAEkAQQBZAFEAQgBzAEEARwB3AEEATABRAEIAagBBAEcAVQBBAGIAQQBCAHMAQQBDAEkAQQBQAGcAQQA4AEEAQwA4AEEAZABBAEIAawBBAEQANABBAEMAZwBBAGcAQQBDAEEAQQBQAEEAQQB2AEEASABRAEEAYwBnAEEAKwBBAEEAbwBBAEkAQQBBAGcAQQBEAHcAQQBkAEEAQgB5AEEAQwBBAEEAYQBRAEIAawBBAEQAMABBAEkAZwBCAHcAQQBHADgAQQBjAEEAQQB0AEEASABJAEEAYgB3AEIAMwBBAEMAMABBAGMAdwBCADAAQQBHAFEAQQBMAFEAQgBrAEEARwBVAEEAZABnAEEAaQBBAEQANABBAEMAZwBBAGcAQQBDAEEAQQBJAEEAQQBnAEEARAB3AEEAZABBAEIAawBBAEQANABBAFUAdwBCADAAQQBHAFEAQQBMAGcAQQBnAEEARQBRAEEAWgBRAEIAMgBBAEMANABBAFAAQQBBAHYAQQBIAFEAQQBaAEEAQQArAEEAQQBvAEEASQBBAEEAZwBBAEMAQQBBAEkAQQBBADgAQQBIAFEAQQBaAEEAQQBnAEEARwBNAEEAYgBBAEIAaABBAEgATQBBAGMAdwBBADkAQQBDAEkAQQBjAHcAQgAwAEEARwBFAEEAWgBnAEIAbQBBAEMAMABBAFkAdwBCAGwAQQBHAHcAQQBiAEEAQQBpAEEARAA0AEEAUABBAEEAdgBBAEgAUQBBAFoAQQBBACsAQQBBAG8AQQBJAEEAQQBnAEEAQwBBAEEASQBBAEEAOABBAEgAUQBBAFoAQQBBAGcAQQBHAE0AQQBiAEEAQgBoAEEASABNAEEAYwB3AEEAOQBBAEMASQBBAGIAZwBCADEAQQBIAEkAQQBjAHcAQgBsAEEAQwAwAEEAWQB3AEIAbABBAEcAdwBBAGIAQQBBAGkAQQBEADQAQQBQAEEAQQB2AEEASABRAEEAWgBBAEEAKwBBAEEAbwBBAEkAQQBBAGcAQQBDAEEAQQBJAEEAQQA4AEEASABRAEEAWgBBAEEAZwBBAEcATQBBAGIAQQBCAGgAQQBIAE0AQQBjAHcAQQA5AEEAQwBJAEEAWgBBAEIAdgBBAEcATQBBAGQAQQBCAHYAQQBIAEkAQQBMAFEAQgBqAEEARwBVAEEAYgBBAEIAcwBBAEMASQBBAFAAZwBBADgAQQBDADgAQQBkAEEAQgBrAEEARAA0AEEAQwBnAEEAZwBBAEMAQQBBAEkAQQBBAGcAQQBEAHcAQQBkAEEAQgBrAEEAQwBBAEEAWQB3AEIAcwBBAEcARQBBAGMAdwBCAHoAQQBEADAAQQBJAGcAQgB2AEEASABZAEEAWgBRAEIAeQBBAEcARQBBAGIAQQBCAHMAQQBDADAAQQBZAHcAQgBsAEEARwB3AEEAYgBBAEEAaQBBAEQANABBAFAAQQBBAHYAQQBIAFEAQQBaAEEAQQArAEEAQQBvAEEASQBBAEEAZwBBAEQAdwBBAEwAdwBCADAAQQBIAEkAQQBQAGcAQQBLAEEAQwBBAEEASQBBAEEAOABBAEgAUQBBAGMAZwBBAGcAQQBHAGsAQQBaAEEAQQA5AEEAQwBJAEEAYwBBAEIAdgBBAEgAQQBBAEwAUQBCAHkAQQBHADgAQQBkAHcAQQB0AEEARwBrAEEAYwBRAEIAeQBBAEMASQBBAFAAZwBBAEsAQQBDAEEAQQBJAEEAQQBnAEEAQwBBAEEAUABBAEIAMABBAEcAUQBBAFAAZwBCAEoAQQBGAEUAQQBVAGcAQQA4AEEAQwA4AEEAZABBAEIAawBBAEQANABBAEMAZwBBAGcAQQBDAEEAQQBJAEEAQQBnAEEARAB3AEEAZABBAEIAawBBAEMAQQBBAFkAdwBCAHMAQQBHAEUAQQBjAHcAQgB6AEEARAAwAEEASQBnAEIAegBBAEgAUQBBAFkAUQBCAG0AQQBHAFkAQQBMAFEAQgBqAEEARwBVAEEAYgBBAEIAcwBBAEMASQBBAFAAZwBBADgAQQBDADgAQQBkAEEAQgBrAEEARAA0AEEAQwBnAEEAZwBBAEMAQQBBAEkAQQBBAGcAQQBEAHcAQQBkAEEAQgBrAEEAQwBBAEEAWQB3AEIAcwBBAEcARQBBAGMAdwBCAHoAQQBEADAAQQBJAGcAQgB1AEEASABVAEEAYwBnAEIAegBBAEcAVQBBAEwAUQBCAGoAQQBHAFUAQQBiAEEAQgBzAEEAQwBJAEEAUABnAEEAOABBAEMAOABBAGQAQQBCAGsAQQBEADQAQQBDAGcAQQBnAEEAQwBBAEEASQBBAEEAZwBBAEQAdwBBAGQAQQBCAGsAQQBDAEEAQQBZAHcAQgBzAEEARwBFAEEAYwB3AEIAegBBAEQAMABBAEkAZwBCAGsAQQBHADgAQQBZAHcAQgAwAEEARwA4AEEAYwBnAEEAdABBAEcATQBBAFoAUQBCAHMAQQBHAHcAQQBJAGcAQQArAEEARAB3AEEATAB3AEIAMABBAEcAUQBBAFAAZwBBAEsAQQBDAEEAQQBJAEEAQQBnAEEAQwBBAEEAUABBAEIAMABBAEcAUQBBAEkAQQBCAGoAQQBHAHcAQQBZAFEAQgB6AEEASABNAEEAUABRAEEAaQBBAEcAOABBAGQAZwBCAGwAQQBIAEkAQQBZAFEAQgBzAEEARwB3AEEATABRAEIAagBBAEcAVQBBAGIAQQBCAHMAQQBDAEkAQQBQAGcAQQA4AEEAQwA4AEEAZABBAEIAawBBAEQANABBAEMAZwBBAGcAQQBDAEEAQQBQAEEAQQB2AEEASABRAEEAYwBnAEEAKwBBAEEAbwBBAFAAQQBBAHYAQQBIAFEAQQBZAGcAQgB2AEEARwBRAEEAZQBRAEEAKwBBAEEAbwBBAFAAQQBBAHYAQQBIAFEAQQBZAFEAQgBpAEEARwB3AEEAWgBRAEEAKwBBAEEAPQA9AAoAcwB1AGYAZgBpAHgAOgA=:31b8e172-b470-440e-83d8-e6b185028602
{
  const button = document.querySelector("#str-truth-button");

  button.onclick = e => {
    const truth_str = document.querySelector("#str-truth-container");
    const pop_param = document.querySelector("#pop-str-parameters");
    if (truth_str.style.visibility === 'visible'){
      truth_str.style.visibility = 'collapse';
      pop_param.style.visibility = 'collapse';
    }
    else {
      truth_str.style.visibility = 'visible';
      pop_param.style.visibility = 'visible';
    }
  };
}
{
// Creates the Histogram
let margin = {top: 10, right: 10, bottom: 30, left: 25};
let width = document.querySelector("#pop-stratified1").clientWidth - margin.left - margin.right;
let height = 250 - margin.top - margin.bottom;
let div = document.querySelector("#str-truth-container").innerHTML = '';
d3.select("#str-truth-container")
.append("p")
.text('Population distribution')
.style('font-size', '0.7em')
.style('margin', 0);
// append the svg object to the body of the page
var svg = d3.select("#str-truth-container")
.append("svg")
.attr("width", width + margin.left + margin.right)
.attr("height", height + margin.top + margin.bottom)
.append("g")
.attr("transform",
"translate(" + margin.left + "," + margin.top + ")");
// X axis: scale and draw:
var x = d3.scaleLinear()
.domain([d3.min(workers, d => d.income-10), d3.max(workers, d => d.income+10)])
.range([margin.left, width - margin.right]);
svg.append("g")
.attr("transform", "translate(0," + `${height - margin.bottom}` + ")")
.call(d3.axisBottom(x).tickSizeOuter(0))
.call(g => g.append("text")
.attr("x", width / 2)
.attr("fill", "currentColor")
.attr("font-weight", "bold")
.attr("text-anchor", "bottom")
.attr('font-size', '16px')
.attr("class", "axis")
.attr("dy", "2.5em")
.text("Income (in thousands of $)")
.attr("class","axes-label"));
// set the parameters for the histogram
var histogram = d3.histogram()
.value(d => d.income) // I need to give the vector of value
.domain(x.domain()) // then the domain of the graphic
.thresholds(x.ticks(30)); // then the numbers of bins
// And apply this function to data to get the bins
var bins1 = histogram(workers.filter(d => d.job === 'staff'));
var bins2 = histogram(workers.filter(d => d.job === 'nurse'));
var bins3 = histogram(workers.filter(d => d.job === 'doctor'));
// Y axis: scale and draw:
var y = d3.scaleLinear()
.range([height - margin.bottom, 0])
.domain([0, d3.max(bins1, d => d.length+100)]); // d3.hist has to be called before the Y axis obviously
svg.append("g")
.attr("transform", `translate(${margin.left},0)`)
.call(d3.axisLeft(y))
.call(g => g.select(".tick:last-of-type text").clone()
.attr("x", -(height - margin.bottom)/2)
.attr("y", -40)
.attr("font-weight", "bold")
.attr('font-size', '16px')
.attr('transform', 'rotate(270)')
.attr("text-anchor", "middle")
.text("Frequency")
.attr("class","axes-label"));
// append the bar rectangles to the svg element
svg.selectAll("rect")
.data(bins1)
.enter()
.append("rect")
.attr("x", 1)
.attr("transform", function(d) { return "translate(" + x(d.x0) + "," + y(d.length) + ")"; })
.attr("width", function(d) { return x(d.x1) - x(d.x0) -1 ; })
.attr("height", function(d) { return height - y(d.length) - margin.bottom; })
.style("fill", "orange")
.style("opacity", '0.5')
.on("mouseenter", (d, i, nodes) => {
// Mouse-over event: turns the bin red and add the number of data points in the bin to the top of the bin
d3.select(d.target).style("opacity", 1);
d3.select(d.target.parentNode)
.append("text")
.attr("x", (x(i.x0) + x(i.x1)) / 2)
.attr("text-anchor", "middle")
.attr("y", y(i.length + 1))
.attr("class", "freq")
.attr('font-size', '0.5em')
.text(i.length)
.property("bar", d.target);
d3.select(d.target).style("cursor", "pointer"); // change the cursor
})
.on("mouseout", (d, i, nodes) => {
// Mouse-out event: returns to the original configuration
if (!d.target.flag) {
d3.select(d.target).style("opacity", 0.6)
d3.select(d.target).style("cursor", "default");
d3.selectAll(".freq")
.filter((e, j, texts) => {
return texts[j].bar === d.target;
}).remove();
}
})
// append the bar rectangles to the svg element
svg.selectAll("rect2")
.data(bins2)
.enter()
.append("rect")
.attr("x", 1)
.attr("transform", function(d) { return "translate(" + x(d.x0) + "," + y(d.length) + ")"; })
.attr("width", function(d) { return x(d.x1) - x(d.x0) -1 ; })
.attr("height", function(d) { return height - y(d.length) - margin.bottom; })
.style("fill", "steelblue")
.style("opacity", '0.5')
.on("mouseenter", (d, i, nodes) => {
// Mouse-over event: turns the bin red and add the number of data points in the bin to the top of the bin
d3.select(d.target).style("opacity", 1);
d3.select(d.target.parentNode)
.append("text")
.attr("x", (x(i.x0) + x(i.x1)) / 2)
.attr("text-anchor", "middle")
.attr("y", y(i.length + 10))
.attr("class", "freq")
.attr('font-size', '0.5em')
.text(i.length)
.property("bar", d.target);
d3.select(d.target).style("cursor", "pointer"); // change the cursor
})
.on("mouseout", (d, i, nodes) => {
// Mouse-out event: returns to the original configuration
if (!d.target.flag) {
d3.select(d.target).style("opacity", 0.6);
d3.select(d.target).style("cursor", "default");
d3.selectAll(".freq")
.filter((e, j, texts) => {
return texts[j].bar === d.target;
}).remove();
}
})
// append the bar rectangles to the svg element
svg.selectAll("rect3")
.data(bins3)
.enter()
.append("rect")
.attr("x", 1)
.attr("transform", function(d) { return "translate(" + x(d.x0) + "," + y(d.length) + ")"; })
.attr("width", function(d) { return x(d.x1) - x(d.x0) -1 ; })
.attr("height", function(d) { return height - y(d.length) - margin.bottom; })
.style("fill", "#69b3a2")
.style("opacity", '0.5')
.on("mouseenter", (d, i, nodes) => {
// Mouse-over event: turns the bin red and add the number of data points in the bin to the top of the bin
d3.select(d.target).style("opacity", 1);
d3.select(d.target.parentNode)
.append("text")
.attr("x", (x(i.x0) + x(i.x1)) / 2)
.attr("text-anchor", "middle")
.attr("y", y(i.length + 1))
.attr("class", "freq")
.attr('font-size', '0.5em')
.text(i.length)
.property("bar", d.target);
d3.select(d.target).style("cursor", "pointer"); // change the cursor
})
.on("mouseout", (d, i, nodes) => {
// Mouse-out event: returns to the original configuration
if (!d.target.flag) {
d3.select(d.target).style("opacity", 0.6);
d3.select(d.target).style("cursor", "default");
d3.selectAll(".freq")
.filter((e, j, texts) => {
return texts[j].bar === d.target;
}).remove();
}
})
// Legend
svg.append("circle").attr("cx",300).attr("cy",20).attr("r", 6).style("fill", "orange")
svg.append("circle").attr("cx",300).attr("cy",40).attr("r", 6).style("fill", "steelblue")
svg.append("circle").attr("cx",300).attr("cy",60).attr("r", 6).style("fill", "#69b3a2")
svg.append("text").attr("x", 310).attr("y", 25).text("Staff").style("font-size", "15px").attr("alignment-baseline","middle")
svg.append("text").attr("x", 310).attr("y", 45).text("Nurse").style("font-size", "15px").attr("alignment-baseline","middle")
svg.append("text").attr("x", 310).attr("y", 65).text("Doctor").style("font-size", "15px").attr("alignment-baseline","middle")
d3.select("#str-truth-container")
.append("p")
.text('A few parameters:')
.style('font-size', '0.7em')
.style('margin', 0)
//Append the table parameters
let pop_table = document.querySelector("#pop-str-parameters");
document.querySelector('#str-truth-container').append(pop_table);
['staff', 'nurse', 'doctor'].forEach(c => {
pop_table.querySelector("#pop-row-mean")
.querySelector(`.${c}-cell`)
.append(document.createTextNode(mean(workers.filter(d => d.job == c).map(d => d.income)).toFixed(2)));
pop_table.querySelector("#pop-row-median")
.querySelector(`.${c}-cell`)
.append(document.createTextNode(quantile(workers.filter(d => d.job == c).map(d => d.income), 0.5).toFixed(2)));
pop_table.querySelector("#pop-row-99quantile")
.querySelector(`.${c}-cell`)
.append(document.createTextNode(quantile(workers.filter(d => d.job == c).map(d => d.income), 0.99).toFixed(2)));
pop_table.querySelector("#pop-row-std-dev")
.querySelector(`.${c}-cell`)
.append(document.createTextNode(std(workers.filter(d => d.job == c).map(d => d.income)).toFixed(2)));
let p25q = quantile(workers.filter(d => d.job == c).map(d => d.income), 0.25).toFixed(2);
let p75q = quantile(workers.filter(d => d.job == c).map(d => d.income), 0.75).toFixed(2);
pop_table.querySelector("#pop-row-iqr")
.querySelector(`.${c}-cell`)
.append(document.createTextNode((p75q - p25q).toFixed(2)));
});
pop_table.querySelector("#pop-row-mean")
.querySelector(`.overall-cell`)
.append(document.createTextNode(mean(workers.map(d => d.income)).toFixed(2)));
pop_table.querySelector("#pop-row-median")
.querySelector(`.overall-cell`)
.append(document.createTextNode(quantile(workers.map(d => d.income), 0.5).toFixed(2)));
pop_table.querySelector("#pop-row-99quantile")
.querySelector(`.overall-cell`)
.append(document.createTextNode(quantile(workers.map(d => d.income), 0.99).toFixed(2)));
pop_table.querySelector("#pop-row-std-dev")
.querySelector(`.overall-cell`)
.append(document.createTextNode(std(workers.map(d => d.income)).toFixed(2)));
let p25q = quantile(workers.map(d => d.income), 0.25).toFixed(2);
let p75q = quantile(workers.map(d => d.income), 0.75).toFixed(2);
pop_table.querySelector("#pop-row-iqr")
.querySelector(`.overall-cell`)
.append(document.createTextNode((p75q - p25q).toFixed(2)));
}Sample
Nurses
Staffs
Doctors
function take_stratified(size, div_selector){

  let div_staff = document.querySelector('#sample-str-staff1');
  let div_nurse = document.querySelector('#sample-str-nurse1');
  let div_doctor = document.querySelector('#sample-str-doctor1');
  div_doctor.innerHTML = '';
  div_staff.innerHTML = '';
  div_nurse.innerHTML = '';

  let sample_elements = Array(size);
  for (let i=0; i < size; i++){
      let randomElement = getRandomElement(emojis);
      if (randomElement.includes('staff')){
        sample_elements[i] = append_sample_element(div_staff, randomElement, '14px');
      }
      if (randomElement.includes('doc')){
        sample_elements[i] = append_sample_element(div_doctor, randomElement, '14px');
      }
      if (randomElement.includes('nurse')){
        sample_elements[i] = append_sample_element(div_nurse, randomElement, '14px');
      }
    }

  return sample_elements;
}
selected_elements_stratified = take_stratified(sample_size_str1, "#sample-stratified");

{
  let text_nodes = document.querySelector('#sample-stratified').querySelectorAll('span')
  text_nodes[0].innerHTML = `Nurse  (n<sub>nurse</sub> = ${selected_elements_stratified.filter(d => d.job == 'nurse').length})`;

  text_nodes[1].innerHTML = ` Staff  (n<sub>staff</sub> = ${selected_elements_stratified.filter(d => d.job == 'staff').length})`;

  text_nodes[2].innerHTML = `Doctor  (n<sub>doctor</sub> = ${selected_elements_stratified.filter(d => d.job == 'doctor').length})`;
}| Statistics | Staff | Nurse | Doctor | Overall |
|---|---|---|---|---|
| Sample Mean | ||||
| Sample Median | ||||
| Sample 0.99-quantile | ||||
| Sample Std. Dev. | ||||
| Sample IQR |
{
  let sample_size = sample_size_str1;

  // Creates the Histogram
  var margin = {top: 10, right: 10, bottom: 30, left: 25},
    width = document.querySelector("#sample-dist-str1").clientWidth - margin.left - margin.right,
    height = 200 - margin.top - margin.bottom;

  document.querySelector("#sample-dist-str1").innerHTML = '';

  d3.select("#sample-dist-str1")
    .append("p")
    .text('Sample distribution')
    .style('font-size', '0.7em')
    .style('margin', 0);


  var svg = d3.select("#sample-dist-str1")
    .append("svg")
      .attr("width", width + margin.left + margin.right)
      .attr("height", height + margin.top + margin.bottom)
    .append("g")
      .attr("transform",
            "translate(" + margin.left + "," + margin.top + ")");

  // X axis: scale and draw:
  var x = d3.scaleLinear()
      .domain([d3.min(selected_elements_stratified, d => d.income-10), d3.max(selected_elements_stratified, d => d.income+10)])
      .range([margin.left, width - margin.right]);

  svg.append("g")
      .attr("transform", "translate(0," + `${height - margin.bottom}` + ")")
      .call(d3.axisBottom(x).tickSizeOuter(0))
      .call(g => g.append("text")
        .attr("x", width / 2)
        .attr("fill", "currentColor")
        .attr("font-weight", "bold")
        .attr("text-anchor", "bottom")
        .attr('font-size', '16px')
        .attr("class", "axis")
        .attr("dy", "2.5em")
        .text("Income (in thousands of $)")
        .attr("class","axes-label"));

  // set the parameters for the histogram
  var histogram = d3.histogram()
      .value(d => d.income)   // I need to give the vector of value
      .domain(x.domain())  // then the domain of the graphic
      .thresholds(x.ticks(40)); // then the numbers of bins


  // And apply this function to data to get the bins
  var bins1  = histogram(selected_elements_stratified.filter(d => d.job === 'staff'));
  var bins2  = histogram(selected_elements_stratified.filter(d => d.job === 'nurse'));
  var bins3  = histogram(selected_elements_stratified.filter(d => d.job === 'doctor'));

  // Y axis: scale and draw:
  var y = d3.scaleLinear()
      .range([height - margin.bottom, 0])
      .domain([0, d3.max(bins1, d => d.length+10)]);   // d3.hist has to be called before the Y axis obviously

  svg.append("g")
      .attr("transform", `translate(${margin.left},0)`)
      .call(d3.axisLeft(y))
      .call(g => g.select(".tick:last-of-type text").clone()
        .attr("x", -(height - margin.bottom)/2)
        .attr("y", -40)
        .attr("font-weight", "bold")
        .attr('font-size', '16px')
        .attr('transform', 'rotate(270)')
        .attr("text-anchor", "middle")
        .text("Frequency")
        .attr("class","axes-label"));

  // append the bar rectangles to the svg element
  svg.selectAll("rect")
      .data(bins1)
      .enter()
      .append("rect")
        .attr("x", 1)
        .attr("transform", function(d) { return "translate(" + x(d.x0) + "," + y(d.length) + ")"; })
        .attr("width", function(d) { return x(d.x1) - x(d.x0) -1 ; })
        .attr("height", function(d) { return height - y(d.length) - margin.bottom; })
        .style("fill", "orange")
        .style("opacity", '0.5')
        .on("mouseenter", (d, i, nodes) => {
            // Mouse-over event: turns the bin red and add the number of data points in the bin to the top of the bin
            d3.select(d.target).style("opacity", 1);
            d3.select(d.target.parentNode)
                .append("text")
                .attr("x", (x(i.x0) + x(i.x1)) / 2)
                .attr("text-anchor", "middle")
                .attr("y", y(i.length + 1))
                .attr("class", "freq")
                .attr('font-size', '0.5em')
                .text(i.length)
                .property("bar", d.target);

            d3.select(d.target).style("cursor", "pointer"); // change the cursor
        })
        .on("mouseout", (d, i, nodes) => {
              // Mouse-out event: returns to the original configuration
              if (!d.target.flag) {
                  d3.select(d.target).style("opacity", 0.6)
                  d3.select(d.target).style("cursor", "default");
                  d3.selectAll(".freq")
                    .filter((e, j, texts) => {
                        return texts[j].bar === d.target;
                    }).remove();
              }
         })

  // append the bar rectangles to the svg element
  svg.selectAll("rect2")
      .data(bins2)
      .enter()
      .append("rect")
        .attr("x", 1)
        .attr("transform", function(d) { return "translate(" + x(d.x0) + "," + y(d.length) + ")"; })
        .attr("width", function(d) { return x(d.x1) - x(d.x0) -1 ; })
        .attr("height", function(d) { return height - y(d.length) - margin.bottom; })
        .style("fill", "steelblue")
        .style("opacity", '0.5')
        .on("mouseenter", (d, i, nodes) => {
            // Mouse-over event: turns the bin red and add the number of data points in the bin to the top of the bin
            d3.select(d.target).style("opacity", 1);
            d3.select(d.target.parentNode)
                .append("text")
                .attr("x", (x(i.x0) + x(i.x1)) / 2)
                .attr("text-anchor", "middle")
                .attr("y", y(i.length + 1))
                .attr("class", "freq")
                .attr('font-size', '0.5em')
                .text(i.length)
                .property("bar", d.target);

            d3.select(d.target).style("cursor", "pointer"); // change the cursor
        })
        .on("mouseout", (d, i, nodes) => {
              // Mouse-out event: returns to the original configuration
              if (!d.target.flag) {
                  d3.select(d.target).style("opacity", 0.6);
                  d3.select(d.target).style("cursor", "default");
                  d3.selectAll(".freq")
                    .filter((e, j, texts) => {
                        return texts[j].bar === d.target;
                    }).remove();
              }
         })


  // append the bar rectangles to the svg element
  svg.selectAll("rect3")
      .data(bins3)
      .enter()
      .append("rect")
        .attr("x", 1)
        .attr("transform", function(d) { return "translate(" + x(d.x0) + "," + y(d.length) + ")"; })
        .attr("width", function(d) { return x(d.x1) - x(d.x0) -1 ; })
        .attr("height", function(d) { return height - y(d.length) - margin.bottom; })
        .style("fill", "#69b3a2")
        .style("opacity", '0.5')
        .on("mouseenter", (d, i, nodes) => {
            // Mouse-over event: turns the bin red and add the number of data points in the bin to the top of the bin
            d3.select(d.target).style("opacity", 1);
            d3.select(d.target.parentNode)
                .append("text")
                .attr("x", (x(i.x0) + x(i.x1)) / 2)
                .attr("text-anchor", "middle")
                .attr("y", y(i.length + 1))
                .attr("class", "freq")
                .attr('font-size', '0.5em')
                .text(i.length)
                .property("bar", d.target);

            d3.select(d.target).style("cursor", "pointer"); // change the cursor
        })
        .on("mouseout", (d, i, nodes) => {
              // Mouse-out event: returns to the original configuration
              if (!d.target.flag) {
                  d3.select(d.target).style("opacity", 0.6);
                  d3.select(d.target).style("cursor", "default");
                  d3.selectAll(".freq")
                    .filter((e, j, texts) => {
                        return texts[j].bar === d.target;
                    }).remove();
              }
         })
  // Legend
  svg.append("circle").attr("cx",300).attr("cy", 20).attr("r", 6).style("fill", "orange")
  svg.append("circle").attr("cx",300).attr("cy", 40).attr("r", 6).style("fill", "steelblue")
  svg.append("circle").attr("cx",300).attr("cy", 60).attr("r", 6).style("fill", "#69b3a2")
  svg.append("text").attr("x", 310).attr("y", 25).text("Staff").style("font-size", "15px").attr("alignment-baseline","middle")
  svg.append("text").attr("x", 310).attr("y", 45).text("Nurse").style("font-size", "15px").attr("alignment-baseline","middle")
  svg.append("text").attr("x", 310).attr("y", 65).text("Doctor").style("font-size", "15px").attr("alignment-baseline","middle")


  d3.select("#sample-dist-str1")
    .append("p")
    .text('A few statistics:')
    .style('font-size', '0.7em')
    .style('margin', 0)

  let sample_str_table = document.querySelector("#sample-str-statistic");
  ['staff', 'nurse', 'doctor'].forEach(c => {
      sample_str_table.querySelector("#sample-row-mean")
                .querySelector(`.${c}-cell`)
                .innerHTML = mean(selected_elements_stratified.filter(d => d.job == c).map(d => d.income)).toFixed(2);

      sample_str_table.querySelector("#sample-row-median")
                .querySelector(`.${c}-cell`)
                .innerHTML = quantile(selected_elements_stratified.filter(d => d.job == c).map(d => d.income), 0.5).toFixed(2);

      sample_str_table.querySelector("#sample-row-99quantile")
                .querySelector(`.${c}-cell`)
                .innerHTML = quantile(selected_elements_stratified.filter(d => d.job == c).map(d => d.income), 0.99).toFixed(2);

      sample_str_table.querySelector("#sample-row-std-dev")
                .querySelector(`.${c}-cell`)
                .innerHTML = std(selected_elements_stratified.filter(d => d.job == c).map(d => d.income)).toFixed(2);

      let p25q = quantile(selected_elements_stratified.filter(d => d.job == c).map(d => d.income), 0.25).toFixed(2);
      let p75q = quantile(selected_elements_stratified.filter(d => d.job == c).map(d => d.income), 0.75).toFixed(2);
      sample_str_table.querySelector("#sample-row-iqr")
                .querySelector(`.${c}-cell`)
                .innerHTML = (p75q - p25q).toFixed(2);
  });

    sample_str_table.querySelector("#sample-row-mean")
             .querySelector(`.overall-cell`)
             .innerHTML = mean(selected_elements_stratified.map(d => d.income)).toFixed(2);

    sample_str_table.querySelector("#sample-row-median")
             .querySelector(`.overall-cell`)
             .innerHTML = quantile(selected_elements_stratified.map(d => d.income), 0.5).toFixed(2);

    sample_str_table.querySelector("#sample-row-99quantile")
             .querySelector(`.overall-cell`)
             .innerHTML = quantile(selected_elements_stratified.map(d => d.income), 0.99).toFixed(2);

    sample_str_table.querySelector("#sample-row-std-dev")
             .querySelector(`.overall-cell`)
             .innerHTML = std(selected_elements_stratified.map(d => d.income)).toFixed(2);

    let p25q = quantile(selected_elements_stratified.map(d => d.income), 0.25).toFixed(2);
    let p75q = quantile(selected_elements_stratified.map(d => d.income), 0.75).toFixed(2);
    sample_str_table.querySelector("#sample-row-iqr")
             .querySelector(`.overall-cell`)
             .innerHTML = (p75q - p25q).toFixed(2);

}
Stratified Random Sampling
In stratified sampling, we study each subpopulation separately and then combine the results for the entire population.
Stratified Sampling tends to perform better than SRS (i.e., there is less variability across samples);
- The more homogeneous the groups are, the better the Stratified Sampling is in comparison to SRS.
Cluster Sampling
SRS and Stratified sampling can be prohibitively expensive;
A more convenient way (but potentially less precise), is cluster sampling;
In cluster sampling, we split the population into groups, called
clusters.- Different from a
stratum, aclusteris supposed to be heterogenous; - Ideally, each cluster has similar composition as the population as a whole;
- Different from a
Cluster Sampling
- For example, we could use as clusters hospital units.
- Each hospital should have similar composition as the population;
Cluster Sampling
- In cluster sampling, we:
- split the population into subpopulations - called
clusters. - get a list of all clusters in the population;
- draw a SRS of clusters;
- split the population into subpopulations - called
Cluster Sampling
Once we have a sample of clusters we can:
Collect the data from all units in the selected clusters; this is called
one-stage cluster;Select a sample of units within each selected cluster using SRS or Stratified Sampling;
two-stage cluster;
Systematic Sampling
Scroll down
- A systematic sample is obtained by selecting every kth individual from the sampling frame;
The effectiveness of this method depends on the structure of the sampling frame.
It could be better, worse, or the same as SRS or even stratified sampling.
Multistage sampling
Multistage sampling involves more than one stage or more than one sampling procedure in obtaining a sample.
Two-stage cluster sampling is an example of multistage sampling.
Sampling problems
Biased samples
If our sampling approach systematically gives us nonrepresentative samples, we say that the sampling method is biased.
Remember, we don’t know if a sample is representative or not since we don’t know the population;
Biased sampling is a property of the approach, not of a given sample.
- Let’s check a few things that can compromise our sample data;
Undercoverage
It occurs when a sampling frame or a sampling procedure completely excludes or underrepresents certain kinds of individuals from the population.
For example, a librarian wants to find out how often UBC students use library service. She only surveys students visiting the Woodward Biomedical Library.
Convenience Sampling
The selection of individuals from the population based on easy availability and accessibility.
For example, a market researcher wants to estimate the average price of housings in Vancouver. He collects information on the prices by sending out a survey to 50 households in his neighbourhood.
Voluntary Response Bias
If the participation in survey is voluntary, individuals with strong opinions tend to respond more often and thus will be overrepresented.
For example, call-in polls, UBC’s optional teaching evaluations, etc…
Nonresponse Bias
Individuals who do not respond in a survey might differ from the respondents in certain aspects (e.g.,mail-in questionnaires);
Voluntary response bias is a form of nonresponse bias; but nonresponse may occur for other reasons.
For example, those who are at work during the day won’t respond to a telephone survey conducted only during working hours.
Response Bias
When a surveyed subject’s response is influenced by how a question is phrased or asked, or due to misunderstanding of a question or unwillingness to disclose the truth, response bias has occurred.
For example, the question, “Have you ever committed a crime?” could pressure the respondents into lying to avoid compromising themselves.
References
Image Attributions
Female Nurse 1: Twitter, CC BY 4.0, via Wikimedia Commons.
Female Nurse 2: Twitter, CC BY 4.0, via Wikimedia Commons.
Female Nurse 3: Twitter, CC BY 4.0, via Wikimedia Commons.
Male Nurse 1: Twitter, CC BY 4.0, via Wikimedia Commons.
Male Nurse 2: Twitter, CC BY 4.0, via Wikimedia Commons.
Female Doctor 1: Google, Apache License 2.0, via Wikimedia Commons.
Female Doctor 2: Google, Apache License 2.0, via Wikimedia Commons.
Female Doctor 3: Google, Apache License 2.0, via Wikimedia Commons.
Male Doctor 1: Google, Apache License 2.0, via Wikimedia Commons.
Male Doctor 2: Google, Apache License 2.0, via Wikimedia Commons.
Female Staff 1: Google, Apache License 2.0, via Wikimedia Commons.
Female Staff 2: Google, Apache License 2.0, via Wikimedia Commons.
Female Staff 3: Google, Apache License 2.0, via Wikimedia Commons.
Male Staff 1: Google, Apache License 2.0, via Wikimedia Commons.
Male Staff 2: Google, Apache License 2.0, via Wikimedia Commons.
Male Staff 3: Google, Apache License 2.0, via Wikimedia Commons.
© 2022 Rodolfo Lourenzutti & Eugenia Yu – Material Licensed under CC By-SA 4.0