viewof mu = {

  let input = Inputs.range([-5, 5], {value: 0, step: 0.1, label: "Mean"});

  d3.select(input)
  .select('input[name="number"]')
  .style("width", "75px");

  d3.select(input)
   .select('input[name="range"]')
   .style("width", "230px");

  return input;
}

viewof sigma = {
  let input = Inputs.range([0.3, 3], {value: 1, step: 0.1, label: "Standard Deviation"})

 d3.select(input)
   .select('input[name="number"]')
   .style("width", "50px");

  d3.select(input)
   .select('input[name="range"]')
   .style("width", "150px");

  return input;
}The 68-95-99.7% Rule
Scroll down
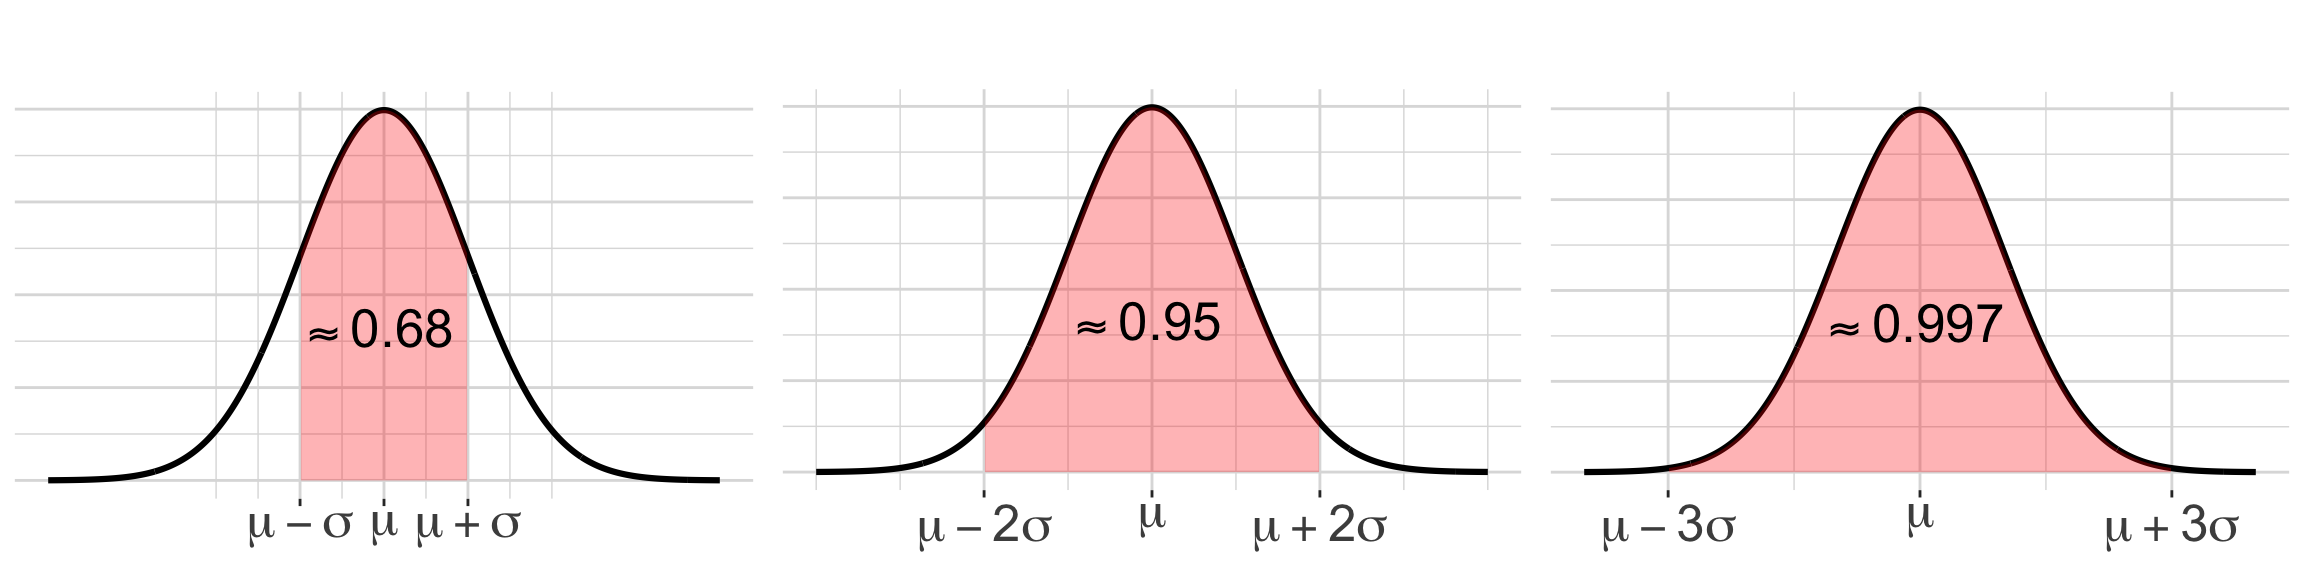
No matter what is the value of \(\mu\) and \(\sigma\) we have the following rule
| Interval | % of data within the interval |
|---|---|
| within \(1\sigma\) of \(\mu\) | about \(68\%\) |
| within \(2\sigma\) of \(\mu\) | about \(95\%\) |
| within \(3\sigma\) of \(\mu\) | about \(99.7\%\) |
- This is an useful approximation for sanity check!
- For actual solutions use R (or a table if you don’t have access to R).
R’s pnorm and qnorm functions
Scroll down
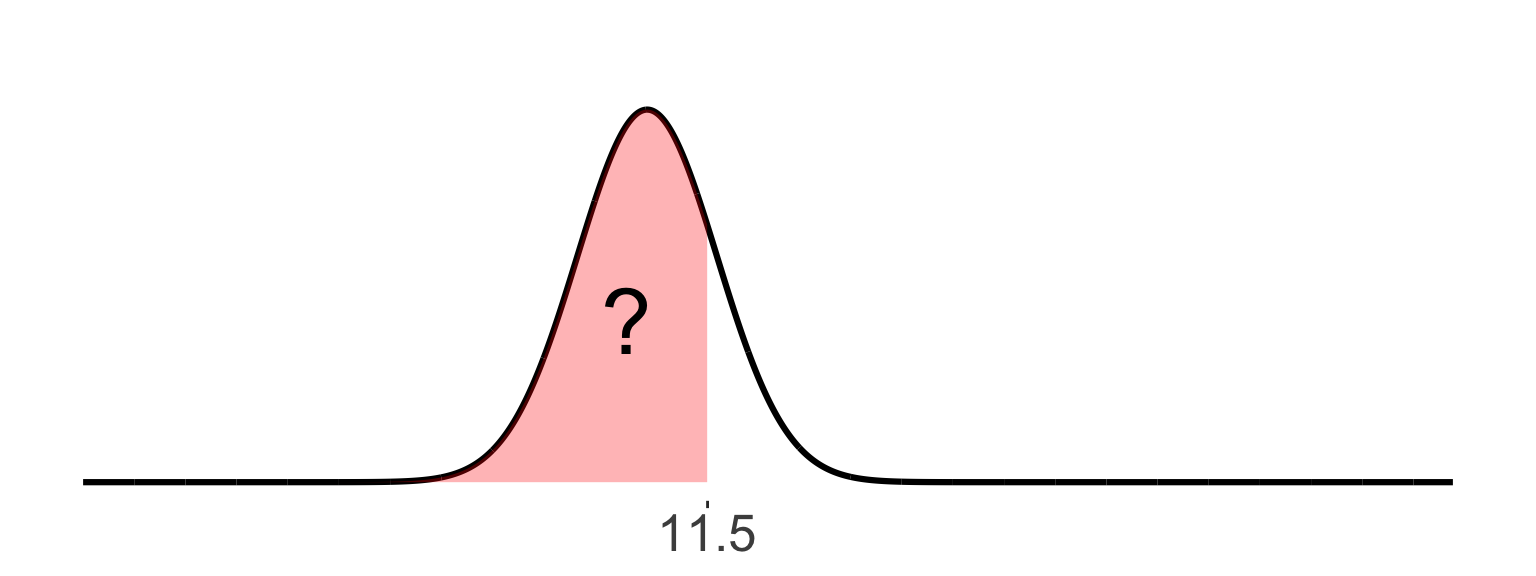
Probability:
To obtain the area under the curve, we use the
pnormfunction.For example, suppose we have a \(N( \mu = 10, \sigma^2 = 3)\) and want the area below 11.5:
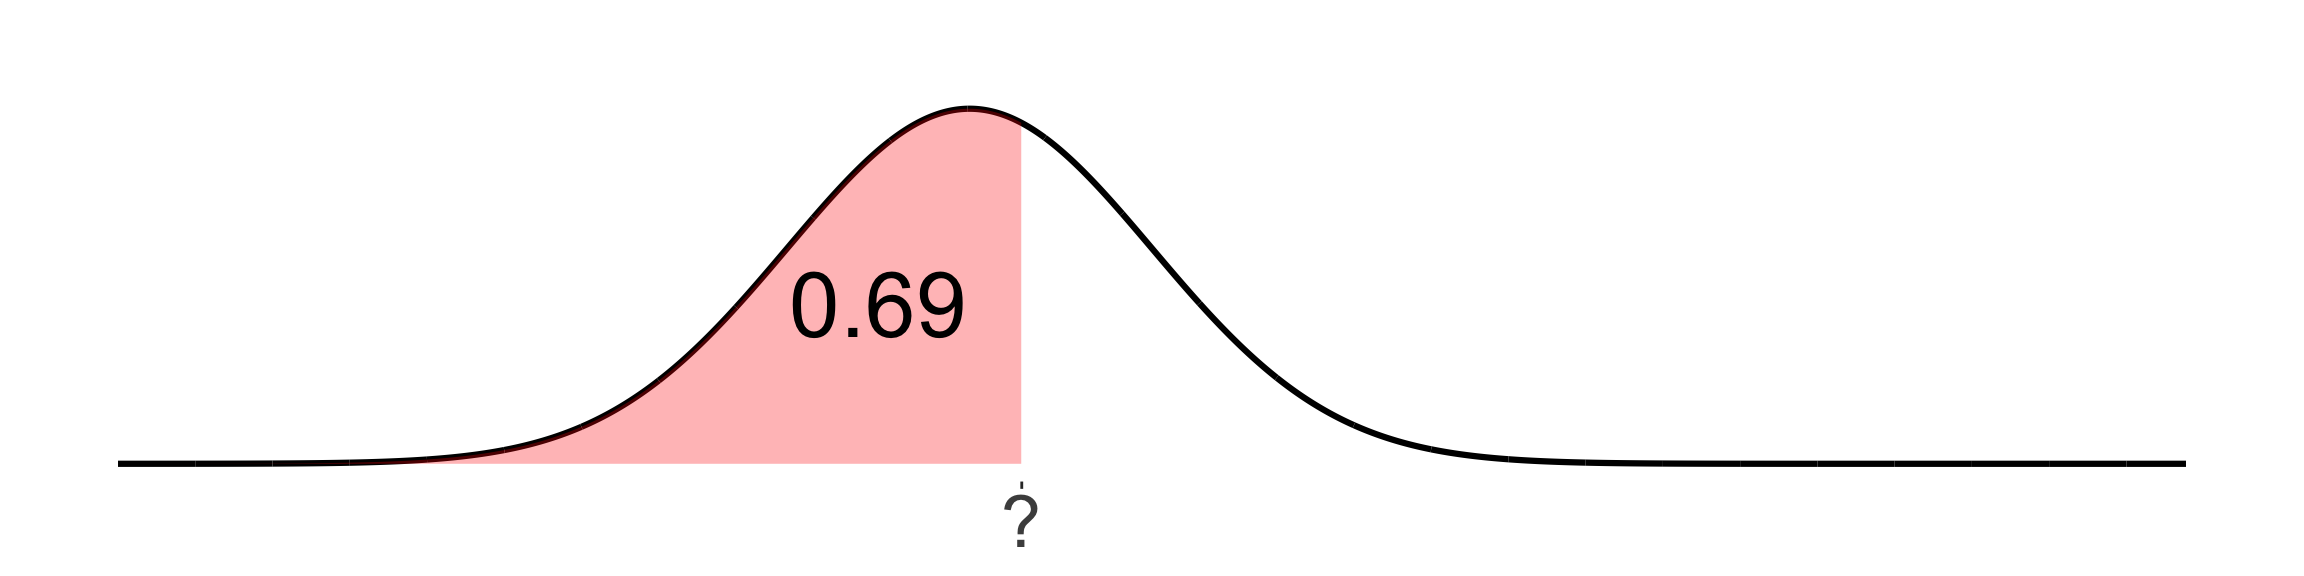
Quantile:
To obtain the quantile of a Normal, we use the
qnormfunction.For example, suppose we have a \(N( \mu = 10, \sigma^2 = 3)\) and want the 0.69-quantile:
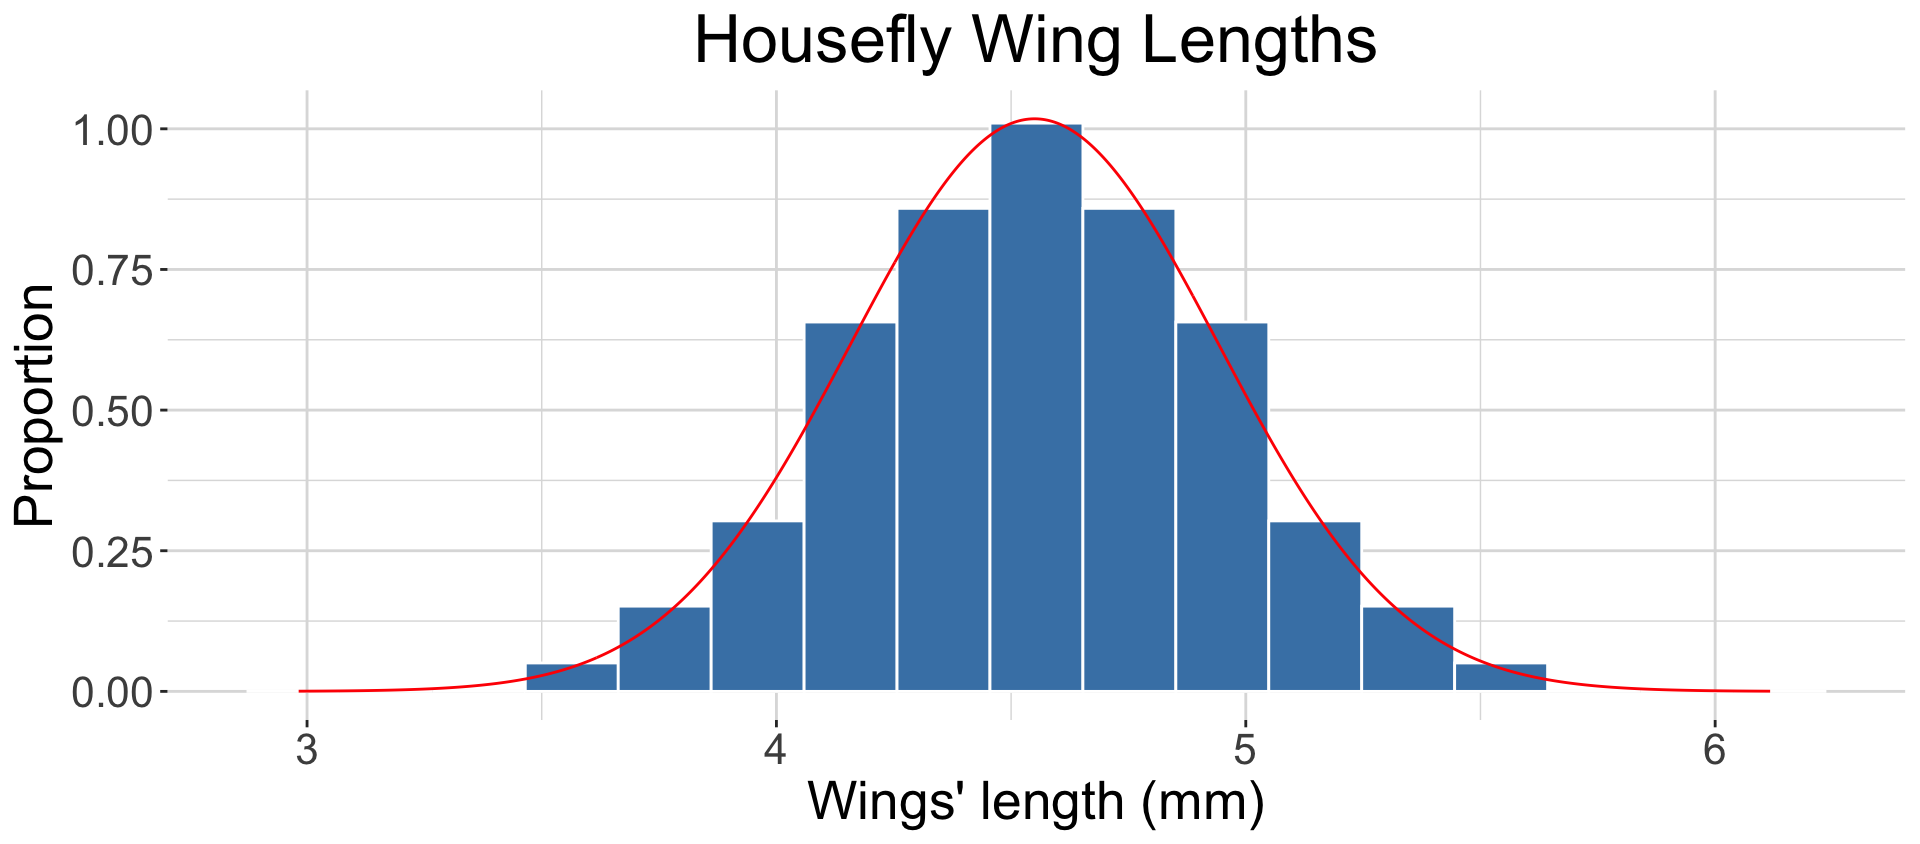
Example 1: Housefly Wing Lengths 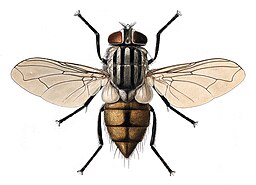
- Sokal and Hunter (1955) studied the wing lengths of houseflies.
Example 2: Birthweight
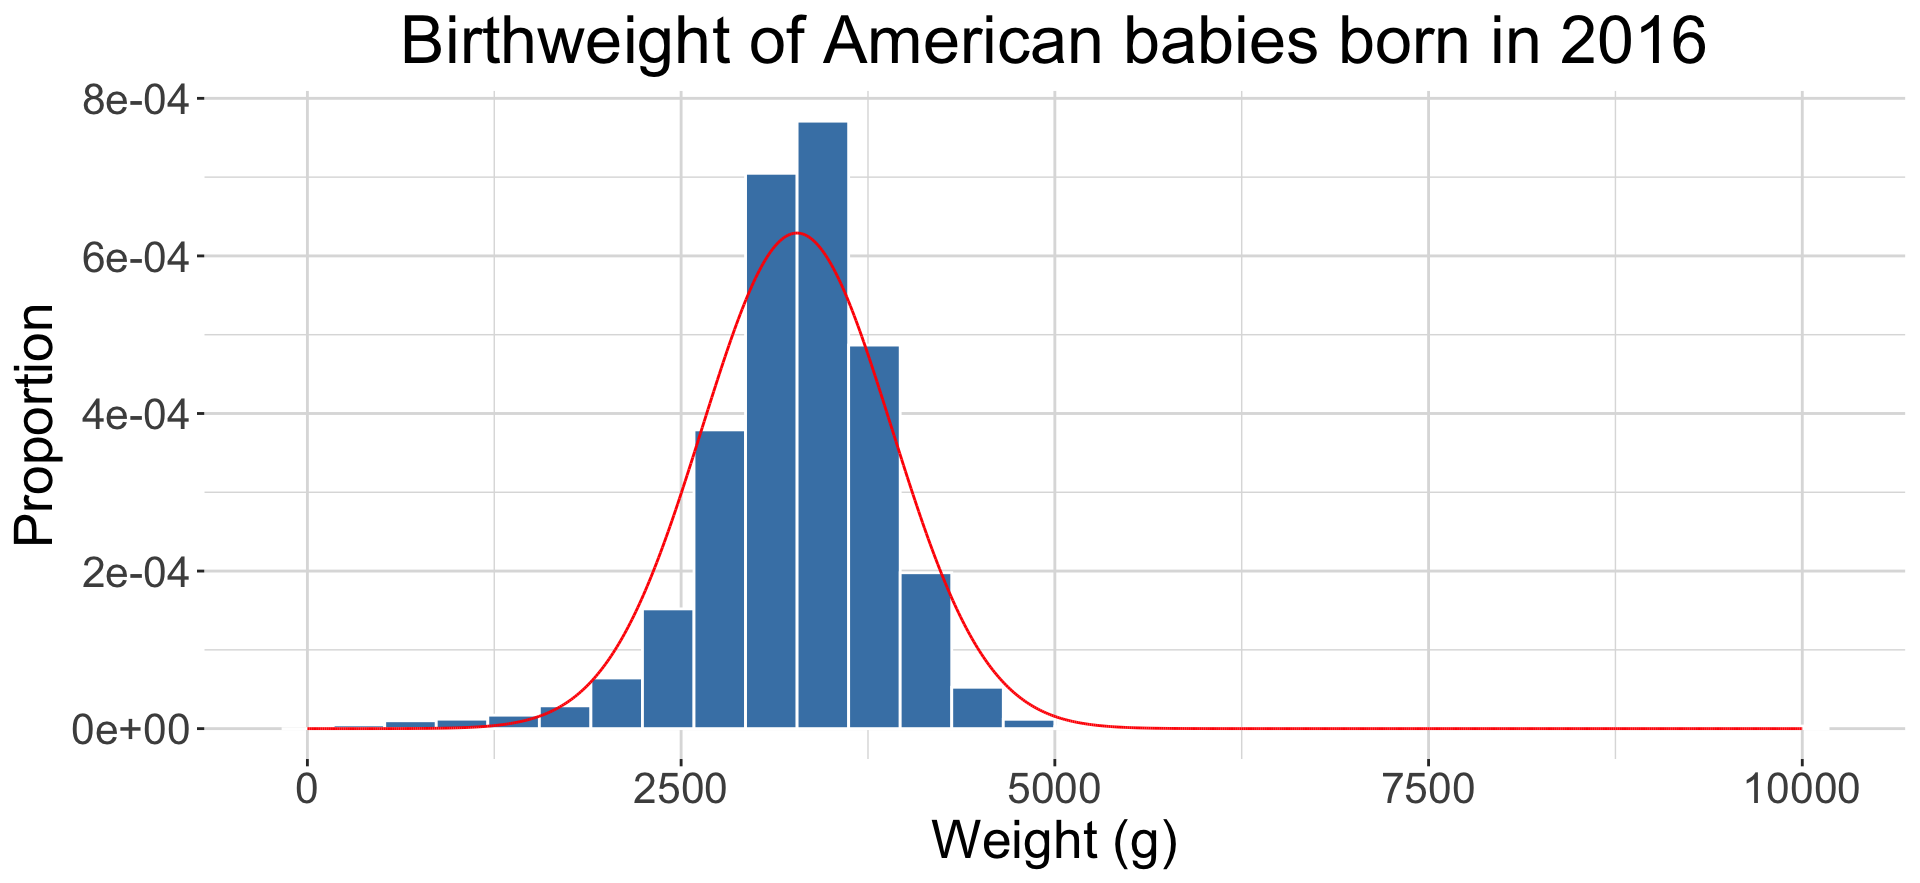
In this case, we have a heavier left tail, which might compromise the Normal approximation.