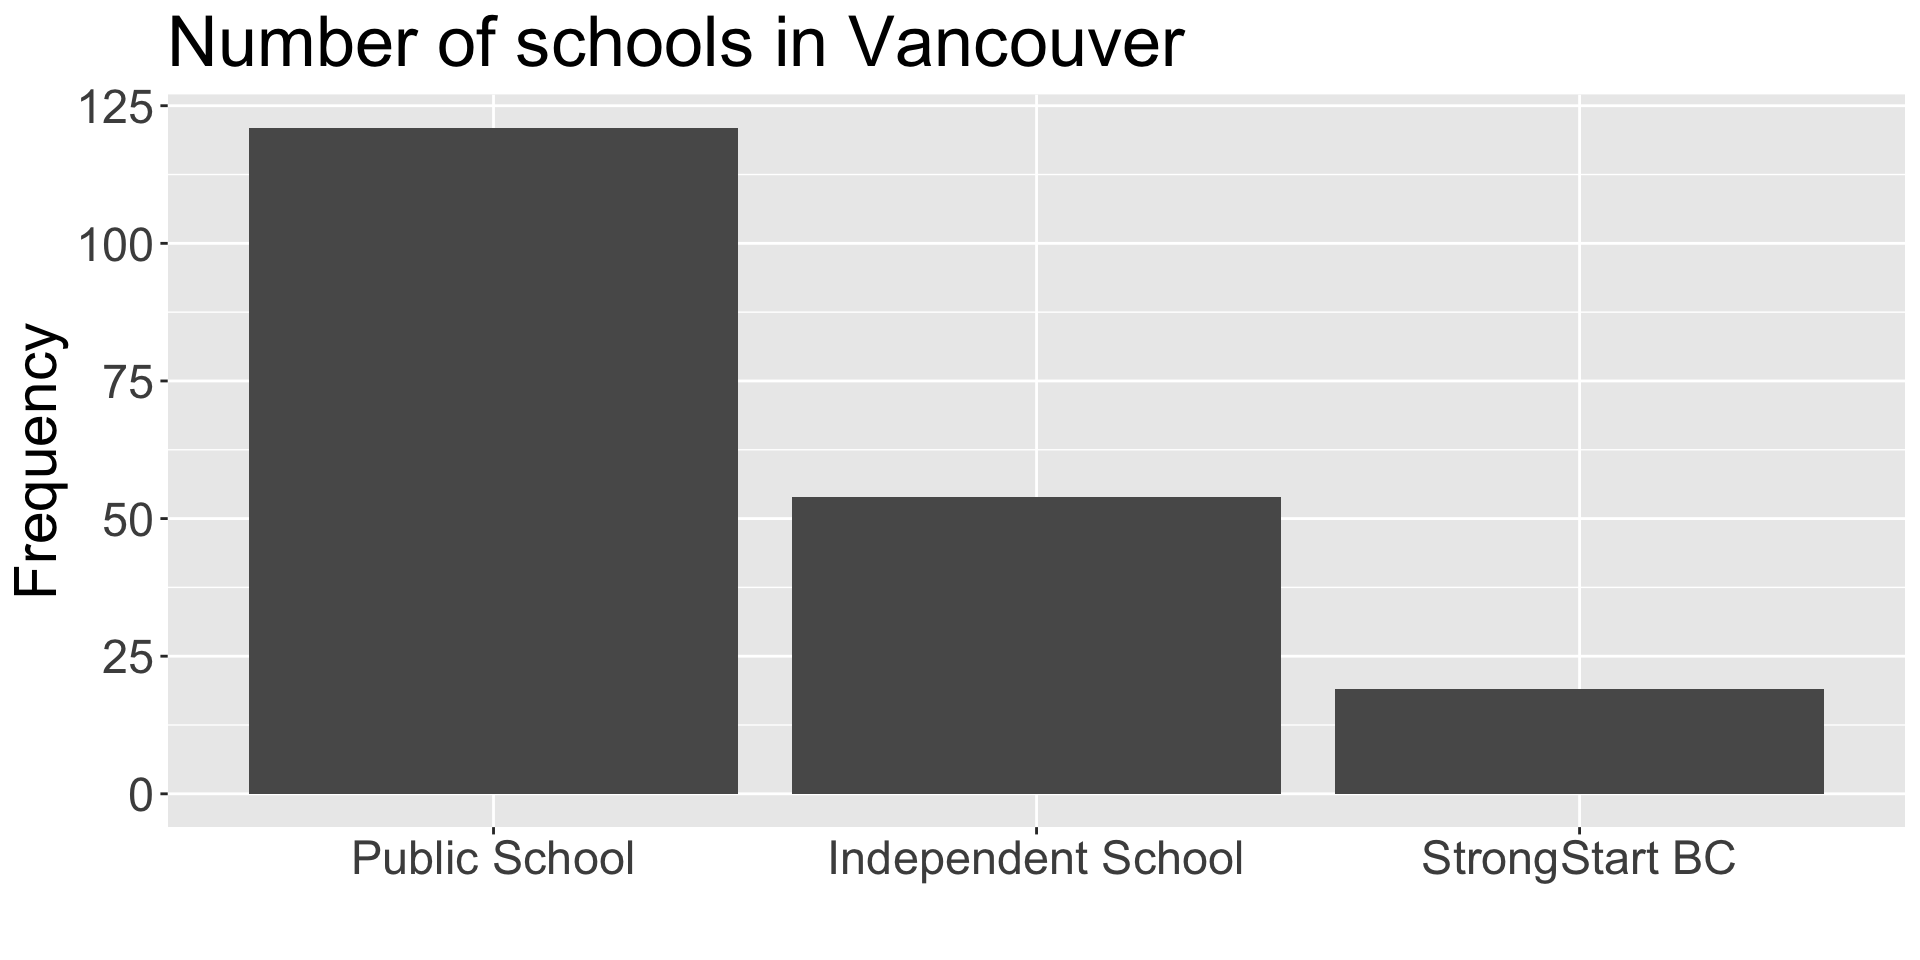
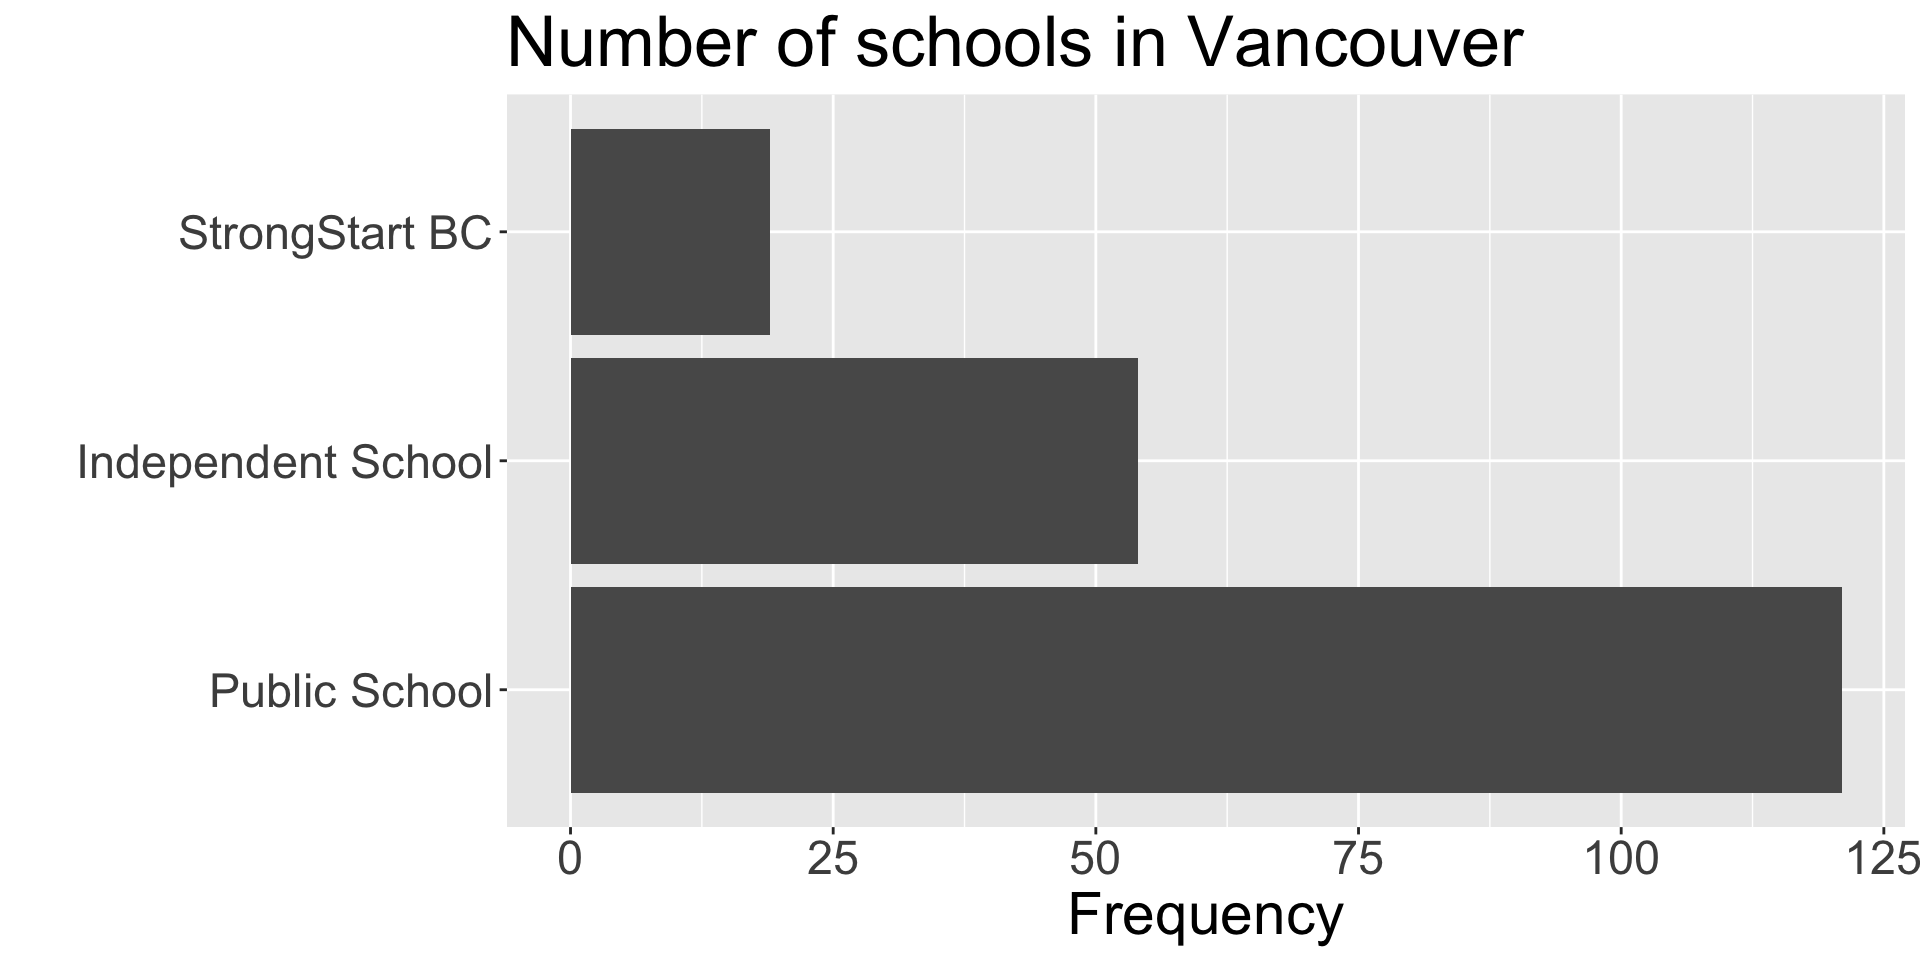
| School Category | n |
|---|---|
| Independent School | 54 |
| StrongStart BC | 19 |
| Public School | 121 |
Exploratory Data Analysis:
Categorical Data
STAT 200 - Lecture 2
Exploratory Data Analysis (EDA)
One of the most critical steps when studying a new problem and dataset.
EDA helps us to:
- better understand the data;
- find new and frequently unexpected relationships between variables;
- raise interesting questions about the study;
Disclaimer
- You are in the driver’s seat of your EDA.
- There’s no single recipe;
- Little thought yields small findings.
- In general, EDA findings are preliminary and often require further investigation.
Categorical Variables
Data
You might need to refresh this page to load the data.
- For this section, let’s consider the dataset of schools in Vancouver.
- Which of the variables in the dataset above is categorical?
Frequency Tables
Bar Chart
Pie Chart (Avoid!)

Pie Chart (Avoid!)

Avoid using pie charts.
When you have many slices and/or the slices are roughly the same size, it becomes impossible to read.
In general, bar charts are much easier to read than pie charts—so stick with them.
Two Categorical Variables
Contingency tables
Appropriate for summarizing the counts of two categorical variables.
Facilitates analysis of the relationship between two categorical variables.
Case Study: Aspirin and Heart Attack
- A controlled, randomized, double-blind study on the effects of aspirin was conducted in the 1980s.
| Drug | Heart Attack | No Heart Attack | Total |
|---|---|---|---|
| Aspirin | 104 | 10,933 | 11,037 |
| Placebo | 189 | 10,845 | 11,034 |
| Total | 293 | 21,778 | 22,071 |
The study was reported on the front page of the New York Times on January 27, 1988. (See the article here.)
A few questions of interest
-
What proportion of individuals did not have a heart attack?
-
What proportion of individuals received a placebo?
-
What proportion of individuals who had a heart attack were on aspirin?
-
What proportion of individuals who were on aspirin had a heart attack?
-
What proportion of individuals were on placebo and had a heart attack?
Marginal Distribution
- What is the proportion of individuals who did not have a heart attack?
| Drug | Heart Attack | No Heart Attack | Total |
|---|---|---|---|
| Aspirin | 104 | 10,933 | 11,037 |
| Placebo | 189 | 10,845 | 11,034 |
| Total | 293 | 21,778 | 22,071 |
| Heart Attack | No Heart Attack |
|---|---|
| 293 (1.33%) | 21,778 (98.67%) |
Answer: 98.67%
Marginal Distribution
- What proportion of individuals received a placebo?
| Drug | Heart Attack | No Heart Attack | Total |
|---|---|---|---|
| Aspirin | 104 | 10,933 | 11,037 |
| Placebo | 189 | 10,845 | 11,034 |
| Total | 293 | 21,778 | 22,071 |
| Aspirin | Placebo |
|---|---|
| 11,037 (50%) | 11,034 (50%) |
Answer: 50%
Conditional Distribution
- What proportion of individuals who had a heart attack were on aspirin?
| Drug | Heart Attack | No Heart Attack | Total |
|---|---|---|---|
| Aspirin | 104 | 10,933 | 11,037 |
| Placebo | 189 | 10,845 | 11,034 |
| Total | 293 | 21,778 | 22,071 |
| Aspirin | Placebo |
|---|---|
| 104 (35.49%) | 189 (64.51%) |
Answer: 35.49%
Note that we condition on heart attack and look at the distribution of drug type.
Conditional Distribution
- What proportion of individuals who were on aspirin had a heart attack?
| Drug | Heart Attack | No Heart Attack | Total |
|---|---|---|---|
| Aspirin | 104 | 10,933 | 11,037 |
| Placebo | 189 | 10,845 | 11,034 |
| Total | 293 | 21,778 | 22,071 |
aspirin
| Heart Attack | No Heart Attack |
|---|---|
| 104 (0.94%) | 10,933 (99.06%) |
Answer: 0.94%
Note that we condition on drug type and look at the distribution of heart attack.
Intersection
- What proportion of individuals were on placebo and had a heart attack?
| Drug | Heart Attack | No Heart Attack | Total |
|---|---|---|---|
| Aspirin | 104 | 10,933 | 11,037 |
| Placebo | 189 | 10,845 | 11,034 |
| Total | 293 | 21,778 | 22,071 |
Answer: \(\frac{189}{22071} = 0.86\%\)
Association
- We can use the contingency table to explore the relationship between the variables.
- What would you expect to see if there was no association between having a heart attack and the drug taken?
- What would you expect to see if there was no association between having a heart attack and the drug taken?
- roughly the same proportion of
heart attacksin theplaceboandaspiringroups;
- roughly the same proportion of
- What would you expect to see if there was no association between having a heart attack and the drug taken?
- the conditional proportions should be similar across groups (e.g., \(P(\text{HA}\mid\text{Aspirin}) \approx P(\text{HA}\mid\text{Placebo})\));
Association
| Drug Type | Heart Attack | No Heart Attack | Total |
|---|---|---|---|
| Aspirin | 104 | 10,933 | 11,037 |
| Placebo | 189 | 10,845 | 11,034 |
| Total | 293 | 21,778 | 22,071 |
- Proportion of people who had a heart attack:
- Proportion of people on
aspirinwho had a heart attack: - Proportion of people on
placebowho had a heart attack:
- Proportion of people who had a heart attack: \(\frac{293}{22071}=\) 1.33%
- Proportion of people on
aspirinwho had a heart attack: \(\frac{104}{11037}=\) 0.94% - Proportion of people on
placebowho had a heart attack: \(\frac{189}{11034}=\) 1.71%
Activity
Consider two over-the-counter topical ointment brands (
Brand AandBrand B) for treating eczema.Eczema patients who have used either brand were asked about the effectiveness of the ointments (i.e., whether the eczema is cured within two weeks).
The results are summarized in the table below:
| Ointment Brand | Eczema | |
|---|---|---|
| Cured | Not Cured | |
| Brand A | 100 (40%) | 150 (60%) |
| Brand B | 200 (50%) | 200 (50%) |
| Total | 300 (46%) | 350 (54%) |
viewof count = {
  let input = Inputs.range([0, 400],
                           {value: 200,
                            step: 1,
                            label: "# patients cured after using Brand B"});
  d3.select(input).select('input[type="number"]').style("display", "none");
  d3.select(input).style("font-size", "0.55em").style('width', '100%');
  d3.select(input).select("label").style('width', '35%');
  //d3.select("#test").style("width", '35%');
  return input;
}

update_entry = (view) => {
  let cell_independent = document.querySelector('#independent-cell');
  let cell_dependent = document.querySelector('#dependent-cell');
  let cell_total_independent = document.querySelector('#total-column-independent');
  let cell_total_dependent = document.querySelector('#total-column-dependent');
  cell_independent.textContent = `${view} (${(100 * view / 400).toFixed(1)}%)`;
  cell_dependent.textContent = `${400 - view} (${(100*(400 - view)/400).toFixed(1)}%)`;
  cell_total_independent.textContent = `${100 + view} (${(100*(100 + view)/650).toFixed(1)}%)`;
  cell_total_dependent.textContent = `${150 + (400 - view)} (${(100*(150 + (400 - view))/650).toFixed(1)}%)`;
}Presence of Eczema among people who used Brand A ointment
data = [
  {"X": "Brand A", "Eczema": "Cured",     "Frequency": 100, "Proportion": 100 / (100 + 150)},
  {"X": "Brand A", "Eczema": "Not cured", "Frequency": 150, "Proportion": 150 / (100 + 150)},
  {"X": "Brand B", "Eczema": "Cured",     "Frequency": count, "Proportion": count / 400},
  {"X": "Brand B", "Eczema": "Not cured", "Frequency": 200, "Proportion": (400 - count) / 400}]


barPlot = Plot.plot({
  x: {
    //axis: null,
    domain: data.Y,
    //range: [150, 300]
  },
  y: {
    grid: true,
    domain: [0, 1]
  },
  marks: [
    Plot.barY(data.filter(d => d.X == 'Brand A'), {x: "Eczema", y: "Proportion", fill: "X", title: "X"}),
    Plot.ruleY([0])
  ],
  style: {
    fontSize: '.45em',
  },
  height: 290,
    width: 478,
    marginLeft: 50,
    marginRight: 50,
    marginTop: 50,
    marginBottom: 50,
});
Presence of Eczema among people who used Brand B ointment
Plot.plot({
  x: {
    domain: data.Y,
  },
  y: {
    grid: true,
    domain: [0, 1]
  },
  marks: [
    Plot.barY(data.filter(d => d.X == 'Brand B'), {x: "Eczema", y: "Proportion", fill: "X", title: "X"}),
    Plot.ruleY([0])
  ],
  style: {
    fontSize: '.45em',
  },
  height: 290,
    width: 478,
    marginLeft: 50,
    marginRight: 50,
    marginTop: 50,
    marginBottom: 50,
});
Case study
Race and Death Penalty in Florida
Does race affect the chance of receiving a death penalty sentence in Florida?
Radelet (1981) examined data on homicide indictments in 20 Florida counties between 1976 and 1977.
| Race | Death Penalty | |
|---|---|---|
| Yes | No | |
| White | 19 | 141 |
| Black | 17 | 149 |
| Total | 36 | 290 |
Case Study: Questions of interest
- Question 1: What proportion of indictments resulted in a death sentence?
- Question 2: Among those who were sentenced to death, what is the proportion of white defendants?
- Question 3: Compare the proportion of white defendants sentenced to death against that of black defendants.
Case Study: Diving Deeper
Death Penalty sentences grouped per victims’ races (Radelet 1981):
| Race | Death Penalty | |
|---|---|---|
| Yes | No | |
| White | 19 | 132 |
| Black | 11 | 52 |
| Total | 30 | 184 |
| Race | Death Penalty | |
|---|---|---|
| Yes | No | |
| White | 0 | 9 |
| Black | 6 | 97 |
| Total | 6 | 106 |
Case Study: Questions of interest
- Question 4: Compare the proportions of indictments that resulted in a death sentence for black and white victims.
- Question 5: For black victims, compare the proportion of white defendants who were sentenced to death against black defendants.
- Question 6: For white victims, compare the proportion of white defendants who were sentenced to death against black defendants.
Simpson’s Paradox
- Question 7: Compare your results in Questions 5 and 6 with the result you obtained in Question 3. Is it surprising?
- This reversal in the direction of association when accounting for a third variable is called Simpson’s Paradox;
Association is not Causation
Although we found that black offenders have a higher chance of being sentenced to death, this does not necessarily mean that it is because of their race.
The race could be the root cause, or a contributing factor, or has nothing to do with it at all;
The cause could be a different underlying factor that affects black offenders more;
- This does not seem to be the case (see the paper for more details).
Today’s quick roadmap
Scroll down
We will answer these questions using marginal, conditional, and joint distributions.
Read a proportion as “out of ___, how many ___?”:
- Marginal: out of everyone, how many are in a certain category?
- \(P(\text{Heart Attack})\) vs \(P(\text{No Heart Attack})\)
- or \(P(\text{Placebo})\) vs \(P(\text{Aspirin})\)
- Conditional: out of a specific group, how many are in certain category?
- \(P(\text{Aspirin}\mid\text{Heart Attack})\) vs \(P(\text{Placebo}\mid\text{Heart Attack})\) (“among those with a heart attack…”)
- or \(P(\text{Heart Attack}\mid\text{Aspirin})\) vs \(P(\text{No Heart Attack}\mid\text{Aspirin})\) (“among those on aspirin…”)
- Joint (intersection): out of everyone, how many satisfy all conditions?
- Example: \(P(\text{Placebo} \cap \text{Heart Attack})\) (“placebo and heart attack”)
- Marginal: out of everyone, how many are in a certain category?
References & Attributions
Image Attributions
- Caravel: Lopo Pizarro, CC BY-SA 3.0, via Wikimedia Commons.
Data Attributions
Schools in Vancouver: available from OpenData Vancouver.
Aspirin Study: published in The New York Times.
- Data used by Efron and Tibshirani (1994)
References
Efron, Bradley, and R. J. Tibshirani. 1994. An Introduction to the Bootstrap. https://doi.org/https://doi.org/10.1201/9780429246593.
Radelet, Michael L. 1981. “Racial Characteristics and the Imposition of the Death Penalty.” American Sociological Review 46 (6): 918–27. http://www.jstor.org/stable/2095088.
© 2023 Rodolfo Lourenzutti & Eugenia Yu – Material Licensed under CC By-SA 4.0