| species | island | bill_length_mm | bill_depth_mm | flipper_length_mm | body_mass_g | sex | year |
|---|---|---|---|---|---|---|---|
| Chinstrap | Dream | 58.0 | 17.8 | 181 | 3700 | female | 2007 |
| Adelie | Biscoe | 36.5 | 16.6 | 181 | 2850 | female | 2008 |
| Adelie | Biscoe | 38.1 | 17.0 | 181 | 3175 | female | 2009 |
| Adelie | Torgersen | 40.6 | 19.0 | 199 | 4000 | male | 2009 |
| Adelie | Biscoe | 37.7 | 18.7 | 180 | 3600 | male | 2007 |
| Gentoo | Biscoe | 52.5 | 15.6 | 221 | 5450 | male | 2009 |
| Adelie | Dream | 36.9 | 18.6 | 189 | 3500 | female | 2008 |
| Gentoo | Biscoe | 51.1 | 16.3 | 220 | 6000 | male | 2008 |
| Gentoo | Biscoe | 44.9 | 13.3 | 213 | 5100 | female | 2008 |
| Gentoo | Biscoe | 48.6 | 16.0 | 230 | 5800 | male | 2008 |
| Adelie | Torgersen | 39.7 | 18.4 | 190 | 3900 | male | 2008 |
| Gentoo | Biscoe | 51.1 | 16.5 | 225 | 5250 | male | 2009 |
| Chinstrap | Dream | 42.4 | 17.3 | 181 | 3600 | female | 2007 |
| Adelie | Torgersen | 38.5 | 17.9 | 190 | 3325 | female | 2009 |
| Adelie | Dream | 36.0 | 17.1 | 187 | 3700 | female | 2009 |
| Adelie | Dream | 37.8 | 18.1 | 193 | 3750 | male | 2009 |
| Chinstrap | Dream | 50.7 | 19.7 | 203 | 4050 | male | 2009 |
| Gentoo | Biscoe | 50.5 | 15.9 | 225 | 5400 | male | 2008 |
| Gentoo | Biscoe | 46.6 | 14.2 | 210 | 4850 | female | 2008 |
| Gentoo | Biscoe | 43.5 | 14.2 | 220 | 4700 | female | 2008 |
| Gentoo | Biscoe | 49.2 | 15.2 | 221 | 6300 | male | 2007 |
| Adelie | Torgersen | 36.6 | 17.8 | 185 | 3700 | female | 2007 |
| Gentoo | Biscoe | 49.1 | 14.8 | 220 | 5150 | female | 2008 |
| Adelie | Dream | 36.5 | 18.0 | 182 | 3150 | female | 2007 |
| Adelie | Biscoe | 37.6 | 17.0 | 185 | 3600 | female | 2008 |
| Gentoo | Biscoe | 50.8 | 17.3 | 228 | 5600 | male | 2009 |
| Adelie | Biscoe | 42.7 | 18.3 | 196 | 4075 | male | 2009 |
| Adelie | Dream | 36.6 | 18.4 | 184 | 3475 | female | 2009 |
| Adelie | Torgersen | 46.0 | 21.5 | 194 | 4200 | male | 2007 |
| Gentoo | Biscoe | 46.5 | 14.5 | 213 | 4400 | female | 2007 |
Welcome to STAT 200
STAT 200 - Lecture 1
Randomness and Uncertainty
Is smoking bad for your health?
How did the medical community conclude that smoking is harmful?
Why is this not a trivial conclusion?
In fact, this conclusion was disputed for years before it was widely accepted.
Is smoking bad for your health?
New drugs
There were over 100 different types of vaccines being tested for COVID-19.
But how do we determine that a vaccine actually works?
- Some vaccinated people get sick; others don’t.
Is the vaccine safe?
- Some vaccinated people develop serious side effects; others don’t.
How do we deal with uncertainties?
We need data!
From the data, we can study the variability and identify patterns or trends in the data.
- But we need to be careful!
- How we collect the data affects how we analyze the data and the type of conclusions we can make.
This is where statistics comes in
Statistics is the science that studies variability.
It provides us with techniques to:
- design studies;
- collect, summarize, and analyze data;
- create and interpret models to draw conclusions;
Confirmation bias
Data are interpreted by people.
The strong convictions some people have may affect how they collect and interpret the data.
For example, people tend to focus on evidence that supports their beliefs and disregard other pieces of evidence.
This phenomenon is called confirmation bias.
Data subtleties
Frequently, people miss some subtleties in the data and make conclusions that are not supported by the data.
For example, what is your interpretation of the following article: “Soaring markets helped the richest 1% gain $6.5 trillion in wealth last year, according to the Fed”
Statistics for all!
Understanding statistical concepts will enable you to assess and question people’s analyses and conclusions critically.
Do not just accept someone’s findings. Think!
- What evidence did they present?
- Is there any evidence they had missed (or buried 😈);
- Do the data and their analysis actually allow them to reach such conclusions?
You are awesome!
You are very capable. THINK! Make your own conclusions!
Don’t feel intimidated by titles. Skepticism and detailed questioning are part of science!
Datasets and variables
Datasets
Statistics is all about using data to analyze the variability and uncertainties involved in a study.
Typically, you can think of a dataset as a table where:
every row corresponds to an individual/object.
every column corresponds to a variable.
Example: Palmer Penguins Dataset
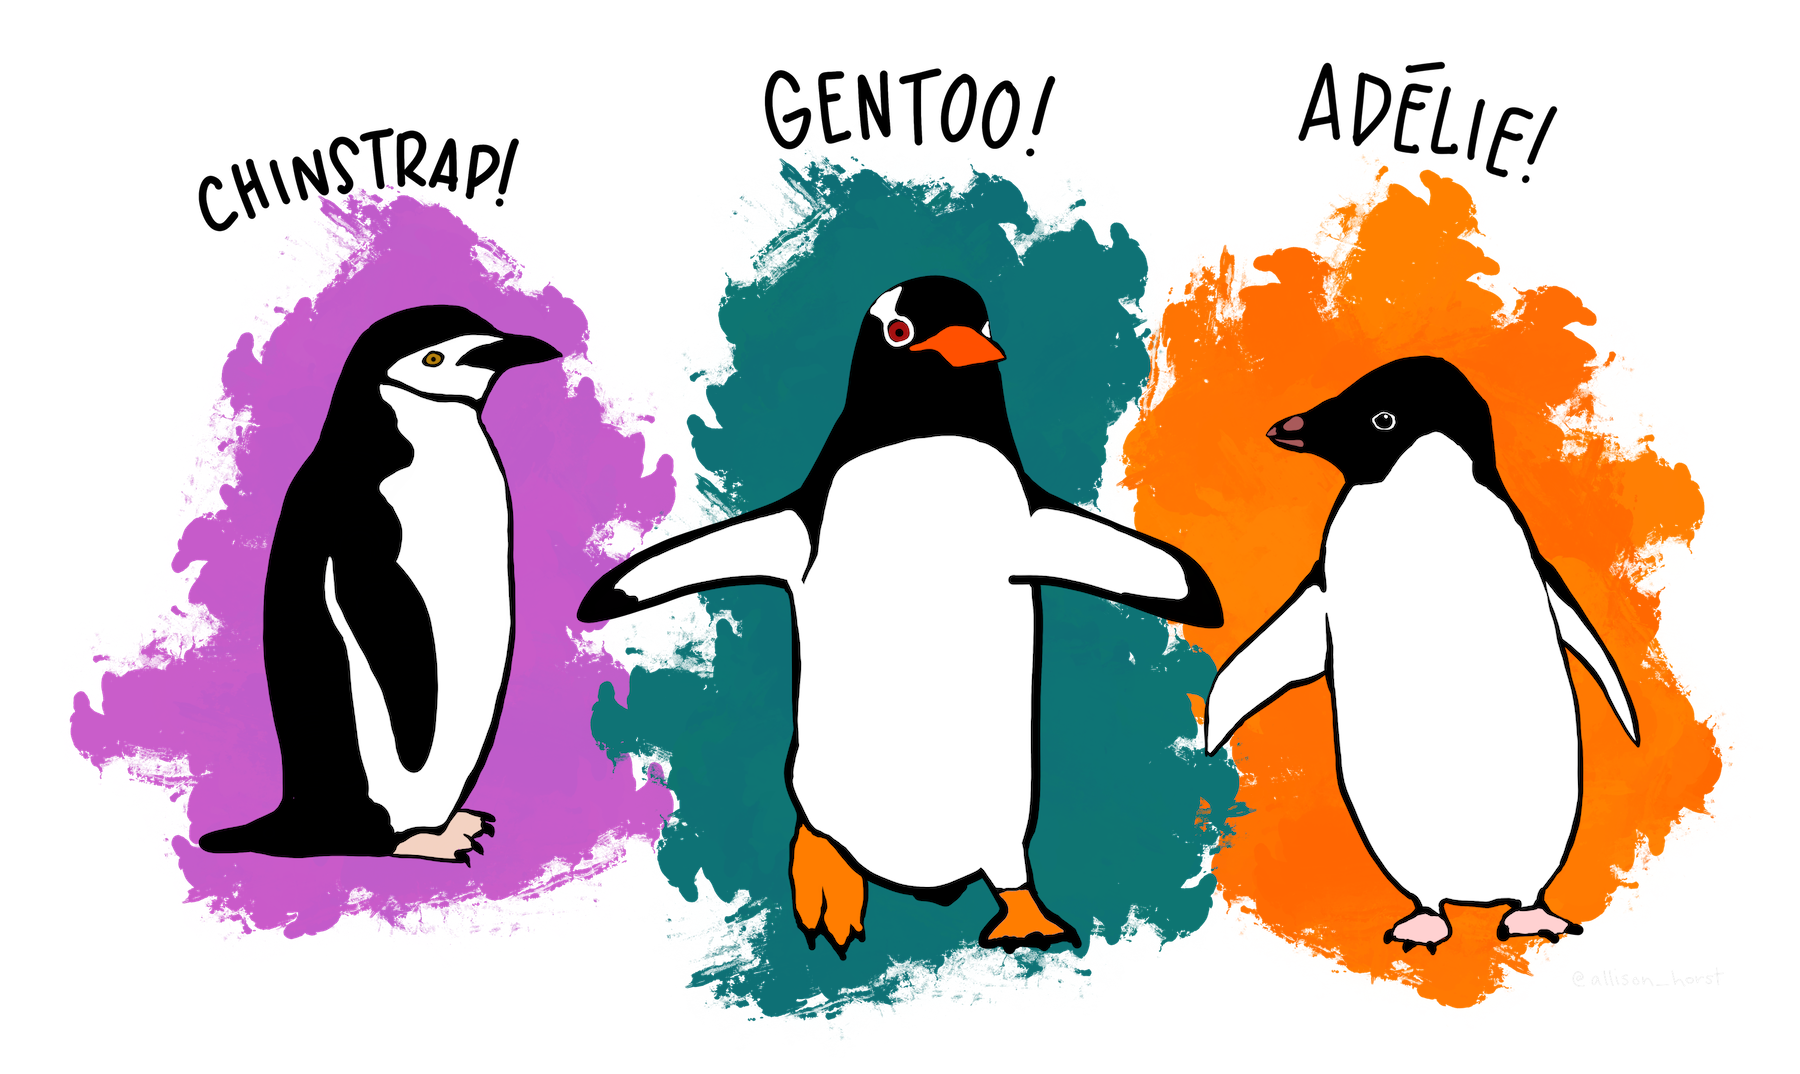
Artwork by @allison_horst
Dr. Kristen Gorman has collected data on 344 penguins from three islands in the Palmer Archipelago, Antarctica.
Artwork by @allison_horst
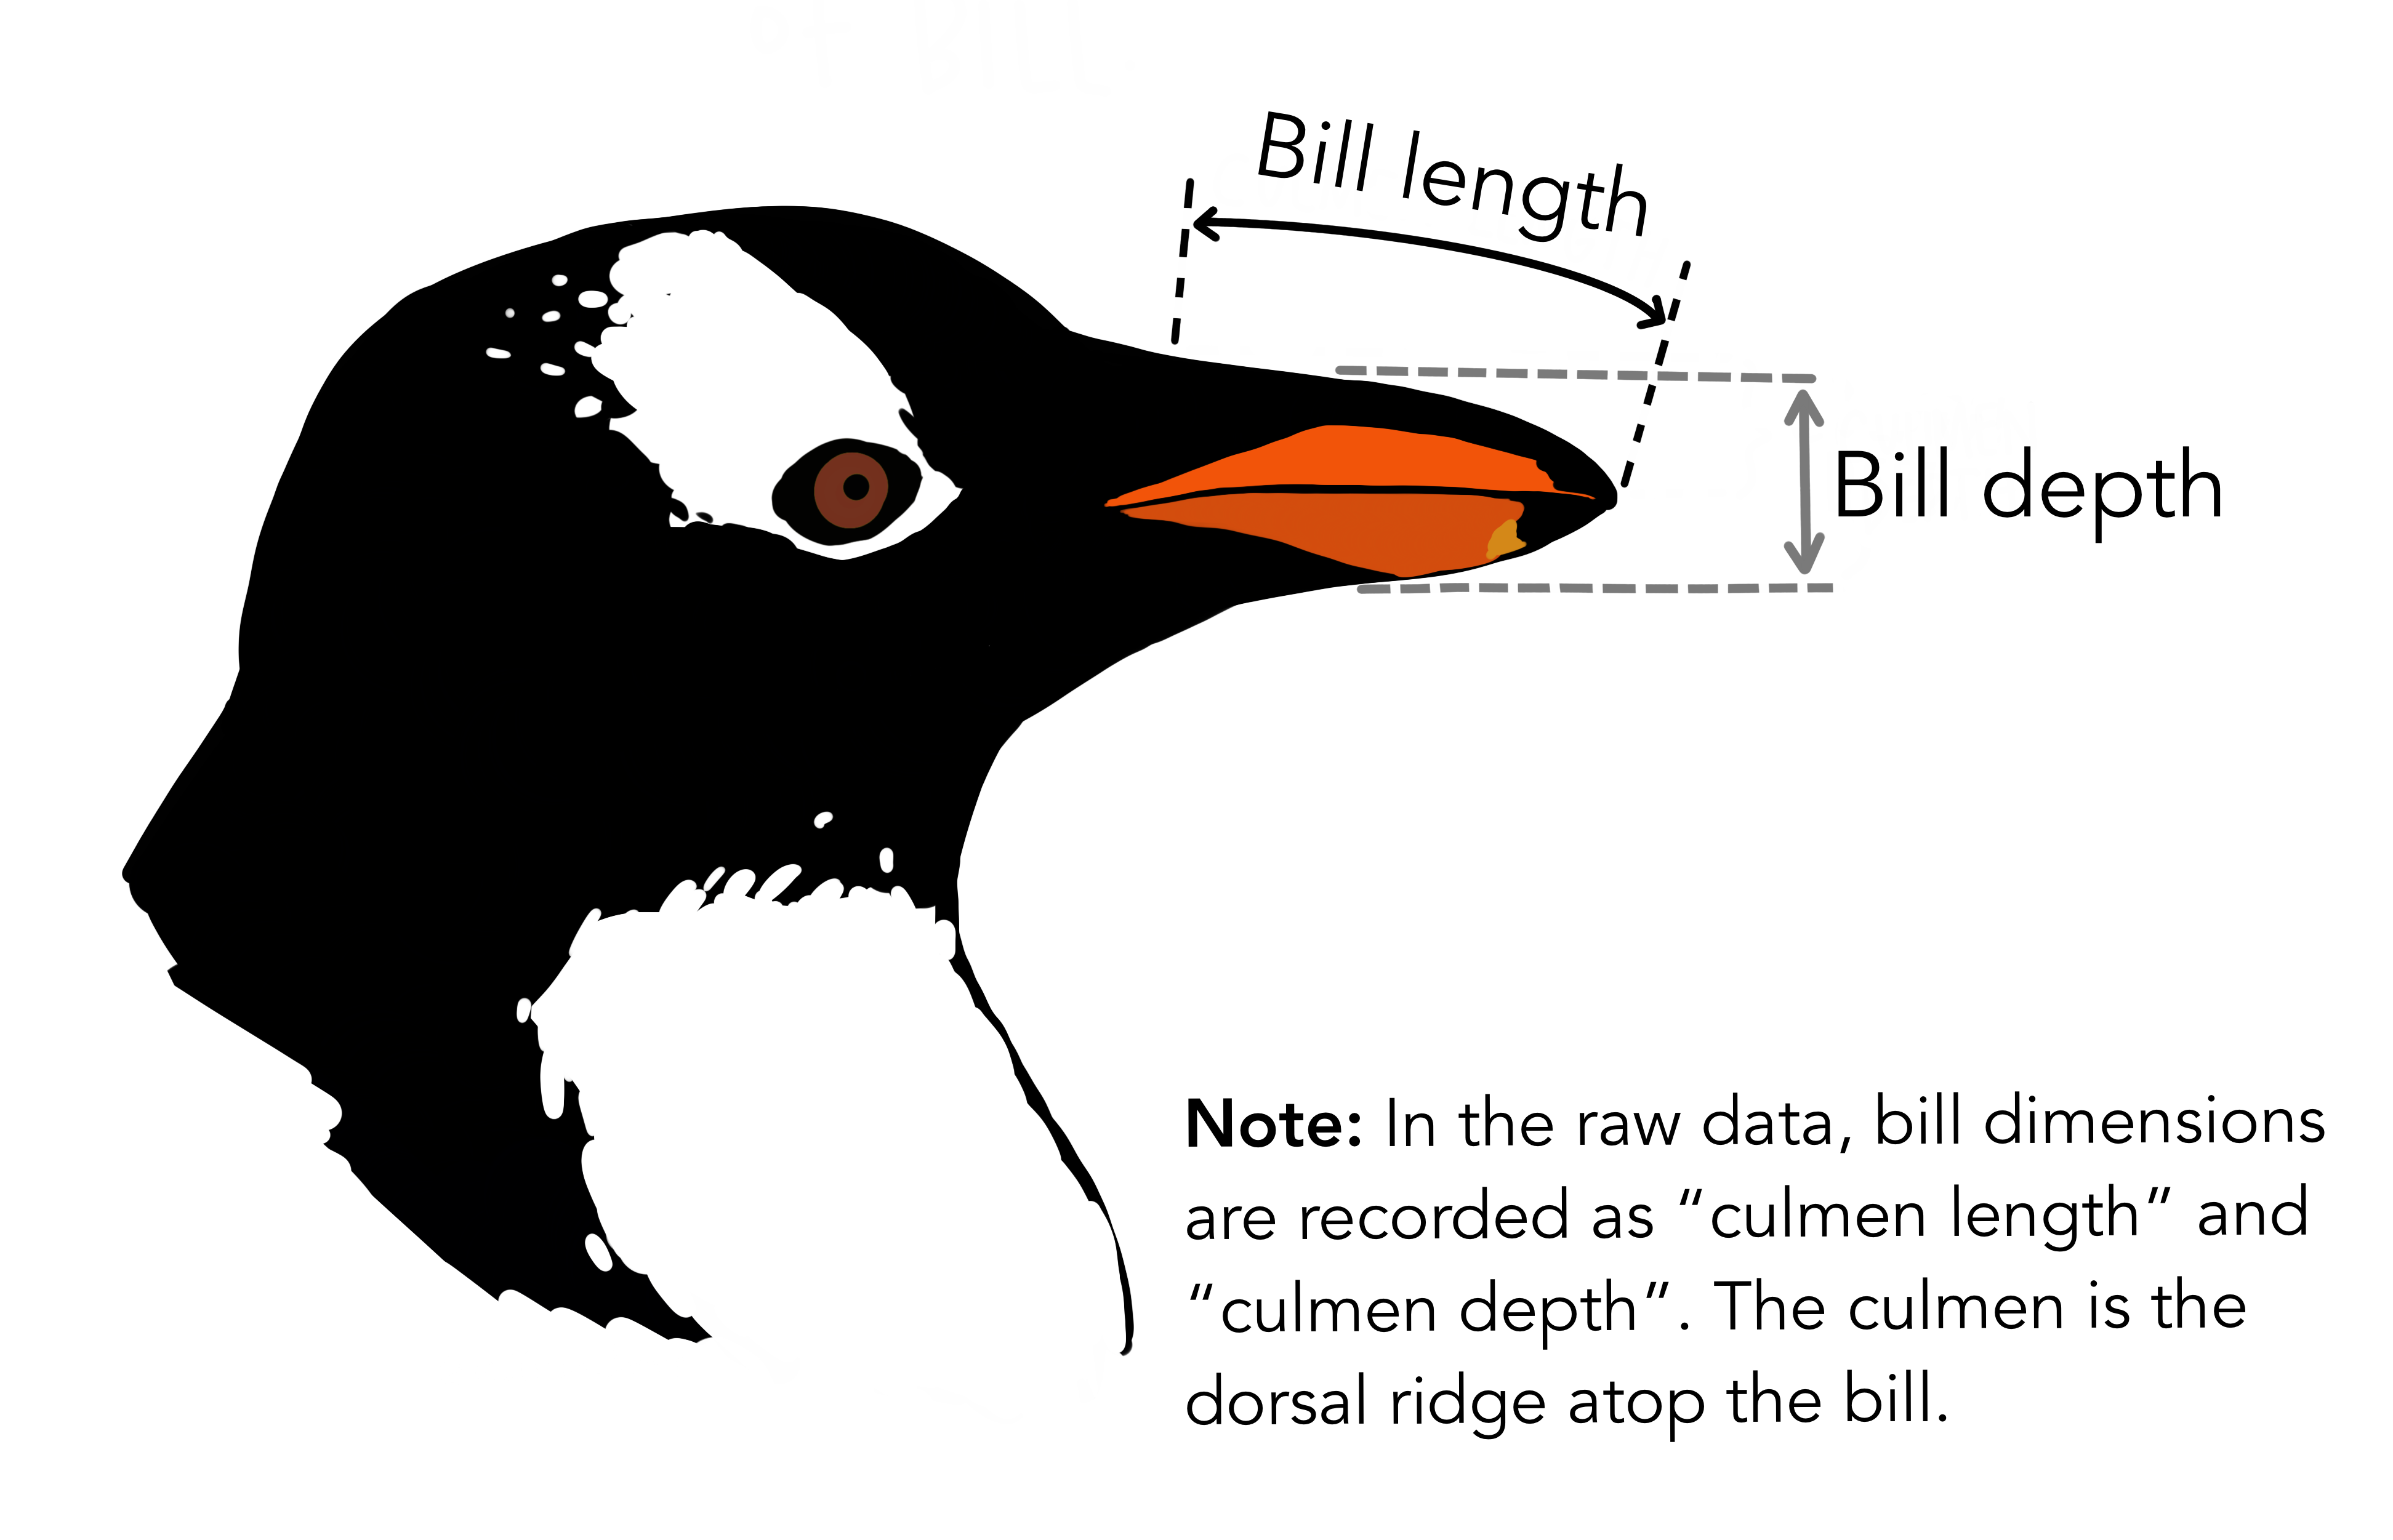
Multiple variables were recorded for each penguin, such as: island, species, bill depth, bill length, body mass, sex, among others.
Example: Palmer Penguins Dataset
Variables
A variable is a characteristic of each individual (or object) of interest.
Variables can be classified as
CategoricalorQuantitative.
Categorical Variables
Categorical variables are variables whose values are categories (e.g., hair color, marital status);
If there is an intrinsic order for the categories, we say the variable is
Ordinal.Pain level: mild, moderate, severe;
Your rank in League of Legends: Iron, Silver, Gold, Diamond;
Quantitative Variables
A variable is quantitative if it is measured on a numerical scale (e.g., income, age, height).
Note that the units of measurement must be provided.
Caution
A variable is not necessarily quantitative just because its values are numbers. Sometimes numbers are used to represent categories.
Activity
| species | island | bill_length_mm | bill_depth_mm | flipper_length_mm | body_mass_g | sex | year |
|---|---|---|---|---|---|---|---|
| Adelie | Dream | 41.1 | 17.5 | 190 | 3900 | male | 2009 |
| Adelie | Dream | 37.3 | 17.8 | 191 | 3350 | female | 2008 |
| Gentoo | Biscoe | 50.5 | 15.9 | 222 | 5550 | male | 2008 |
| Chinstrap | Dream | 49.8 | 17.3 | 198 | 3675 | female | 2009 |
| Adelie | Biscoe | 45.6 | 20.3 | 191 | 4600 | male | 2009 |
| Adelie | Biscoe | 37.6 | 19.1 | 194 | 3750 | male | 2008 |
| Adelie | Dream | 40.7 | 17.0 | 190 | 3725 | male | 2009 |
| Adelie | Dream | 40.8 | 18.4 | 195 | 3900 | male | 2007 |
| Gentoo | Biscoe | 42.0 | 13.5 | 210 | 4150 | female | 2007 |
| Adelie | Torgersen | 34.6 | 21.1 | 198 | 4400 | male | 2007 |
| Gentoo | Biscoe | 46.8 | 15.4 | 215 | 5150 | male | 2007 |
| Gentoo | Biscoe | 47.2 | 15.5 | 215 | 4975 | female | 2009 |
| Gentoo | Biscoe | 48.2 | 15.6 | 221 | 5100 | male | 2008 |
| Adelie | Torgersen | 46.0 | 21.5 | 194 | 4200 | male | 2007 |
| Gentoo | Biscoe | 48.4 | 14.6 | 213 | 5850 | male | 2007 |
| Gentoo | Biscoe | 54.3 | 15.7 | 231 | 5650 | male | 2008 |
| Chinstrap | Dream | 46.7 | 17.9 | 195 | 3300 | female | 2007 |
| Gentoo | Biscoe | 45.2 | 16.4 | 223 | 5950 | male | 2008 |
| Gentoo | Biscoe | 49.1 | 14.8 | 220 | 5150 | female | 2008 |
| Adelie | Biscoe | 34.5 | 18.1 | 187 | 2900 | female | 2008 |
| Gentoo | Biscoe | 43.3 | 13.4 | 209 | 4400 | female | 2007 |
| Adelie | Dream | 39.8 | 19.1 | 184 | 4650 | male | 2007 |
| Adelie | Biscoe | 38.2 | 18.1 | 185 | 3950 | male | 2007 |
| Gentoo | Biscoe | 42.9 | 13.1 | 215 | 5000 | female | 2007 |
| Chinstrap | Dream | 50.9 | 19.1 | 196 | 3550 | male | 2008 |
| Adelie | Torgersen | 35.7 | 17.0 | 189 | 3350 | female | 2009 |
| Adelie | Torgersen | 35.1 | 19.4 | 193 | 4200 | male | 2008 |
| Chinstrap | Dream | 51.9 | 19.5 | 206 | 3950 | male | 2009 |
| Adelie | Dream | 37.0 | 16.5 | 185 | 3400 | female | 2009 |
| Chinstrap | Dream | 50.8 | 18.5 | 201 | 4450 | male | 2009 |
- Categorize each variable in the penguins data frame as
categoricalorquantitative.
References & Attributions
Image Attributions
Cigarettes: Marcus Quigmire from Florida, USA, CC BY-SA 2.0, via Wikimedia Commons.
Drug vials: Image Attribution: Neilsmith38, CC BY-SA 4.0, via Wikimedia Commons
Artwork by @allison_horst.
.jpg)
References
Horst, Allison Marie, Alison Presmanes Hill, and Kristen B Gorman. 2020. Palmerpenguins: Palmer Archipelago (Antarctica) Penguin Data. https://doi.org/10.5281/zenodo.3960218.
© 2023 Rodolfo Lourenzutti & Eugenia Yu – Material Licensed under CC By-SA 4.0